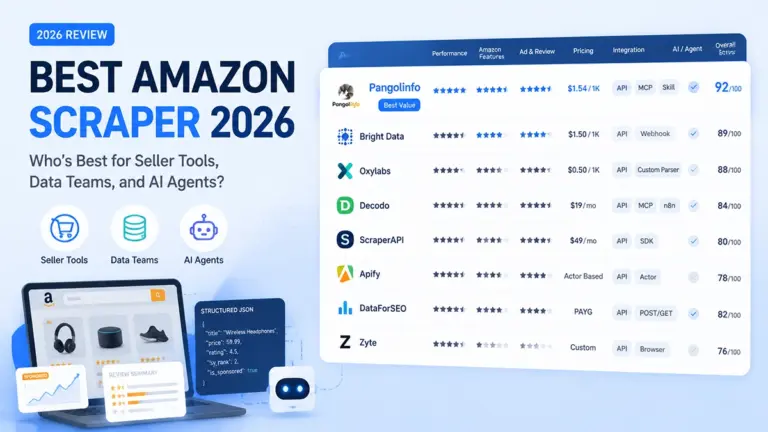

There is no universally best Amazon data API. There is only the one with the highest usable record rate under your field contract. This is not ranking number however-many. It is a blind test you can run yourself: write down the fields your business actually depends on, fire the same ASINs at four or more vendors, and measure coverage, fill rate and cost per thousand usable records. Almost every article ranking for “best Amazon data API” skips that step entirely.
If you are evaluating Amazon data vendors right now, you have almost certainly hit the same wall of near-identical pages. “Top 10 Best Amazon Scraper APIs in 2026.” A comparison grid. A row of blue checkmarks under each vendor. Entry pricing. The author’s own product at number one.
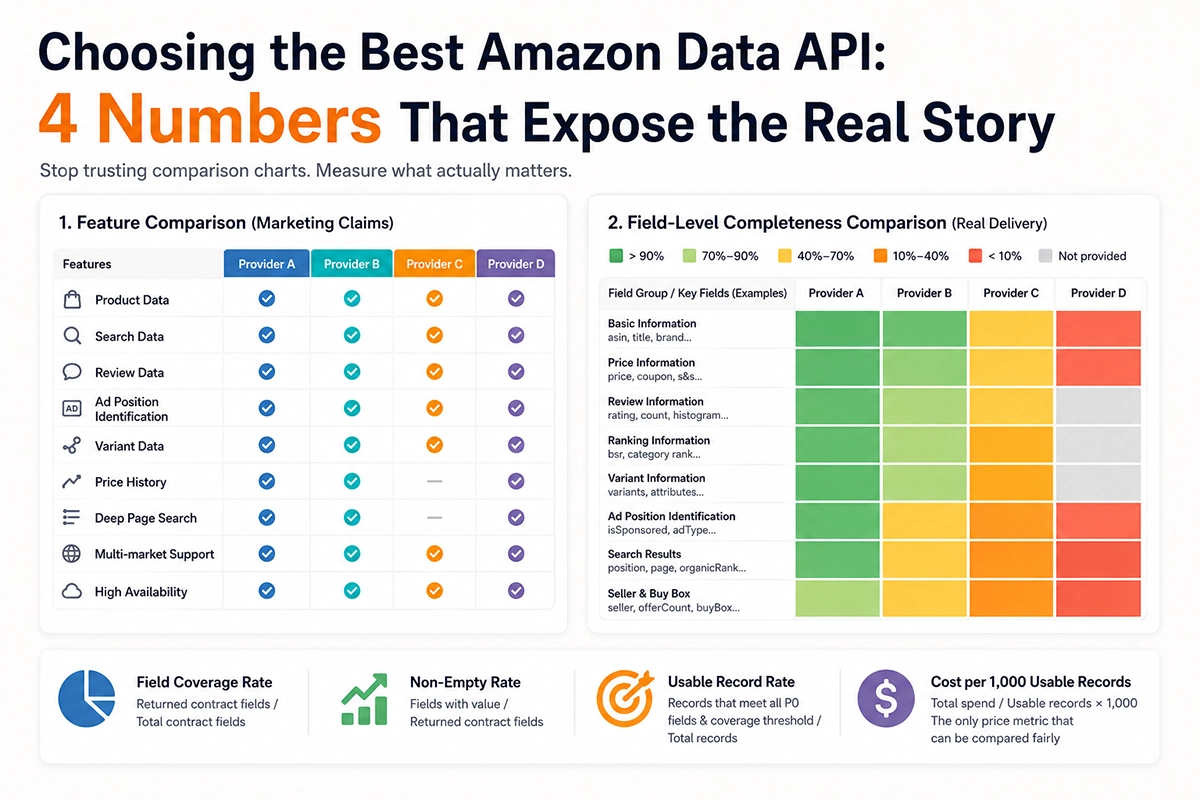
The problem is not that the rankings are wrong. It is that the measurement underneath them is wrong. They treat “supported or not supported” — a binary — as the primary basis for a decision whose outcome is determined by continuous quantities: field coverage, non-null fill rate, usable record rate, effective cost per usable record. A checkbox grid flattens all of it.
So this article does one thing. It replaces “which one is best” with “how do you measure.” Method included. Script included. The rest is your own two days of work. If you want the broader selection framework first, read Amazon Data API: The Complete Buyer’s Guide.
1. Answering the question first: which one is actually best?
A direct answer is useless here, because people asking the same question are usually trying to solve three different problems.
The first group only wants their own operational data — orders, inventory, their own listing performance, their own advertising metrics. For that there is no second option. The official SP-API is the only compliant source, no third party can give it to you, and you should be suspicious of anyone claiming otherwise.
The second group wants market data — competitor prices, search rankings, reviews, sponsored placements. Here the differences between vendors are enormous, but they are not differences in whether a feature exists. They are differences in how complete the returned fields are and whether those fields actually come back with values.
The third group wants history and trend — model training, backtesting, baselines. That is a dataset purchase, not an API purchase, and it is evaluated on entirely different grounds.
The best answer for these three groups is rarely the same vendor, and often not even the same category of product. So the correct response to “which is best” is a counter-question: what is your field contract?
A field contract is a list you write yourself, enumerating the fields your business genuinely depends on. Once you have it, “which is best” becomes computable: across an identical set of ASINs, who returns contract-satisfying records at the lowest cost? That reframing is the spine of everything below.
2. Why “best API” listicles are almost always useless
Before the method, it is worth being precise about why the existing content fails. This is not a moral failing. It is structural: the person writing the listicle does not have access to the data that would make the listicle good, so they fall back on proxies they can obtain.
Flaw one: “supported” is an information black hole
Pick any comparison table. The “Product Data” row is a line of checkmarks. What hides underneath that checkmark?
Take one ASIN and two vendors who both claim to support product data. One returns twelve fields: ASIN, title, main image, current price, rating, review count, category rank, brand, availability, shipping method, seller name, date first listed. The other returns fifty-eight. On top of the first list, that second response carries a historical price range, coupon amount and type, Subscribe & Save discount, the variant list with per-variant price and availability, sub-category BSR breakdowns, an A+ content flag, a climate pledge flag, sponsored placement flags with organic position, promotion labels, estimated delivery windows, and seller ratings with fulfilment method.
On a feature grid those two vendors are the same checkmark. In your reporting they are the difference between a project that ships and one that does not.
And field count is not even the whole story. A field existing is not the same as a field having a value. Some responses carry all fifty-eight fields with twenty of them permanently null. The contract is satisfied, the delivery is not. This is harder to catch than a missing field, because schema validation passes cleanly.
Flaw two: the ranking criteria have almost nothing to do with real cost
Listicles love entry price. But Amazon data services are billed four different ways, and the four are not comparable:
| Billing basis | Headline price | What actually happens |
|---|---|---|
| Per request | Cheapest, most seductive | Failed requests bill too; deep pages and retries multiply cost |
| Per successful result | Middle | HTTP 200 with missing fields still counts as success — you pay full price for a broken record |
| Per record | Impossible to rank at a glance | Only comparable once converted to cost per thousand usable records |
| Monthly quota | Priciest, least friction | Overage rates are usually steep and rarely on the pricing page |
On the same workload, vendor A billing per request can quote a third of vendor B billing per record and still cost more in practice — because A’s deep-page availability is poor, retries are frequent, and failed attempts bill anyway. This kind of inversion is common in real evaluations, and entry-price comparisons can never surface it.
The only comparable number is cost per thousand usable records: total spend over a period, divided by the number of records that made it downstream and passed your field contract, times one thousand. You have to run it yourself. No listicle will hand it to you.
The traps hiding inside each billing basis — and how to turn a quote into a real cost per thousand usable records — are unpacked in Amazon data API pricing traps.
Flaw three: the author is on the list
This one needs little explanation. Nearly every vendor in this category has published their own “Best Amazon Scraper API” post. The value of such a post is not its conclusion — it is what it reveals accidentally. You can read a great deal from what a vendor does not mention. A provider that never brings up variant-level data most likely does not do it well.
So stop looking for a ranking. Compiling a shortlist is easy. Judging what each name on it actually delivers for the fields you care about is the hard part — and it is something only you can measure. Fortunately it is not complicated. The method starts in section 6; first, two steps that have to come before it.
3. Categorise before you compare: the structural boundaries of four provider types
Before comparing any two vendors, there is a prior step: confirm they are in the same category at all. Amazon data providers are not ranked along a single track. They fall into four structurally different groups, each with failure conditions that are hard limits rather than a matter of vendor effort.
Two axes define the categories: where the data authorisation comes from (your own authorised account versus publicly visible market data) and how structured the schema is (raw pages you parse yourself versus typed fields you can consume directly).

Category one: official channel APIs
SP-API and the Advertising API are the representatives here. Legitimacy comes from an explicit agreement between you and the platform: developer registration, seller authorisation through Login with Amazon, and app-level roles granting least-privilege access. Fields touching personally identifiable information require a restricted role and a separate review.
What they are guaranteed to do well: everything in the account domain. Orders, inventory, fulfilment, your own listings, your own advertising performance, buyer messages under restriction. The accuracy has no competitor, because the source is the platform itself.
Where the boundary is hard: authorisation is scoped strictly to accounts a seller has explicitly authorised. You cannot get another seller’s orders, you cannot get market-wide search rankings, you cannot get a competitor’s price history. That is not “not supported yet.” It is not offered by design. On top of that, rate limiting is a token-bucket model applied per operation — different operations carry different rates and quotas with different refill speeds, so a single global QPS plan does not work. You have to budget per operation and implement per-operation backoff.
The reason underneath that boundary — the SP-API authorises against a seller account rather than against the marketplace, so competitor data was never inside its scope — is worth understanding properly, because it decides whether an evaluation is even worth running. We worked through it in why the official API cannot return competitor data. Treat it as a permanent constraint; waiting for it to change costs more than designing around it.
Category two: general-purpose scraping APIs
These sell proxy pools, anti-bot handling and JavaScript rendering, and hand you the page. Parsing is your problem. The product is infrastructure, not data.
What they are guaranteed to do well: breadth. Anything publicly visible is theoretically reachable, unconstrained by a vendor’s schema design. If a niche field is printed on the page, you can extract it.
Where the boundary is hard: parsing responsibility sits entirely with you. A page redesign breaks your parser, and it breaks silently — an exception at least raises an alarm, whereas a parser returning a tidy pile of nulls does not. Someone on the team has to own selector maintenance indefinitely. That headcount almost never makes it into the evaluation spreadsheet, and it typically dwarfs the API subscription by an order of magnitude. Anti-bot countermeasures are also a permanent arms race: you are buying availability today, not a guarantee for next quarter.
Category three: vertical Amazon data APIs
Built specifically for Amazon, returning structured schemas with documented field definitions. This is the focus of this article and what most people searching “best Amazon data API” are actually looking for.
What they are guaranteed to do well: time to first value. Fields have names, types and documentation; redesigns are the vendor’s problem; you do not staff a parsing team. Integration drops from weeks to hours.
Where the boundary is hard: you only get the fields the vendor designed. Requirements outside the schema have no answer short of a feature request and a wait. And schema designs vary enormously between vendors with no public benchmark to compare against — which is precisely the gap this article exists to close.
Category four: offline datasets and bulk delivery
Historical snapshots delivered by category or marketplace, used for training models, backtesting and building baselines.
What they are guaranteed to do well: time depth. Three years of price curves, full historical review corpora — things no real-time endpoint will give you at a sane price.
Where the boundary is hard: decay. A snapshot starts ageing the moment it is delivered, and it cannot answer “what is true right now.” Trend chasing, real-time monitoring and dynamic pricing cannot run on datasets alone.
The point of categorising is that cross-category comparison is wasted effort. Asking whether the SP-API or a vertical data API is “better” has no answer, because one serves account data and the other market data, and the overlap is close to zero. The comparison that genuinely needs doing is within category three — and category three is exactly the group with no public benchmark.
4. What actually hurts with each approach
The previous section covered structural boundaries. This one covers the specific traps — the things that recur in production, not theoretical risks.
Official channels: process and quota costs outside engineering
The biggest pain is not technical, it is procedural. App review, restricted role applications, the seller authorisation flow — the whole sequence takes time. For a team that only needs market data, the return on that investment is poor.
Second is quota planning. Rate limits are per-operation token buckets: each operation has its own rate and quota, and refill speeds differ. “How many requests per second do we need” is too coarse to be useful. You budget per operation type and implement backoff per operation type. Plenty of teams read the rate-limit documentation properly for the first time only after they scale up and eat a round of 429s.
Third is PII restriction. Fields tied to buyer identity need a restricted role with strict review criteria. That determines whether buyer-level analysis is possible at all, and it kills a lot of business cases at this step.
General scraping APIs: the quiet transfer of responsibility
When you buy this category you are not buying data, you are buying “the ability to get the page back.” Data quality remains your problem end to end. Three consequences follow.
- Redesigns are incidents. Amazon’s page structure changes more often than most people expect. Once your selectors break, if your code catches the exception you will get a stream of structurally valid empty records instead of an error.
- Nobody owns field drift. The same field lives in different places across categories, marketplaces and page templates. You cannot enumerate every template, so you accept a fill rate that decays over time.
- A large share of the cost is headcount. A mid-sized scraping operation typically consumes somewhere between half and one full engineer on parser maintenance. This line item is nearly always missing from the comparison spreadsheet.
None of this means the path is wrong. If you have someone dedicated to it and your requirements genuinely exceed every available schema, building in-house is reasonable. What does not work is treating it as the “cheap alternative” in a cost comparison — that calculation comes out wrong almost every time.
Vertical data APIs: no benchmark, so you have to trust the copy
This is the category this article most wants to fix. Differences between vertical vendors are large, but there is no public, comparable measure of them. The result is that selection runs on marketing copy, and every vendor’s copy says complete, reliable, extensive coverage.
It shows up as four specific information asymmetries.
First, field lists are not published at field level. Most vendors describe object-level capability — “we offer product data, review data, search data” — and stop there. You cannot get a complete field dictionary before signing.
Second, fill rate is never disclosed. Coverage (does the schema have the field) and fill rate (does the field come back with a value) are different things, and the second is almost never published.
Third, “failure” is defined inconsistently. “99% success” means the HTTP 200 ratio at one vendor and the internal completeness-check pass ratio at another. The two can differ by more than ten percentage points.
Fourth, deep-page and long-tail availability is unstated. Everyone handles the first two pages. Past page three the differences are dramatic — and that tail is exactly where competitive density is decided.
Offline datasets: cannot tell you about now
Decay is the main issue, but there is a less discussed one: dataset fields often do not match the real-time API’s fields. You train on history, connect the live endpoint, discover the fields and the semantics do not line up, and redo the feature engineering. Before buying, confirm that history and real time share one schema.
And “real time” itself is a term worth pinning down — what it means and which latency tier you need are covered in real-time Amazon data API.
5. What the industry still has not solved
The last section covered known pain points. This one covers the part that is rarely admitted: not something one vendor does badly, but things the industry as a whole currently cannot do, or can do but will not talk about. These gaps set the ceiling on what your project can achieve.
Gap one: no public benchmark for field completeness
This is the root one. Every vertical vendor says their coverage is comprehensive, and not one has published “here is our usable record rate under this field contract.” Without a benchmark, comparison stalls at object level — and object-level comparison has already been shown to have no discriminating power. Remember twelve fields versus fifty-eight.
This gap will not close on its own, because publishing field-level data is risky for a vendor: disclose it and your weaknesses become legible. So as a buyer, you have to build the benchmark yourself. That is the entire reason the framework in the next section exists.
Gap two: almost nobody serves deep search pages reliably
Pages one and two, everyone handles. From page three onward, availability falls off a cliff. The consequence is worse than it sounds.
Competitive density depends on depth. A keyword whose first three pages are full of strong incumbents and one whose first three pages are full of weak ones call for opposite decisions. Seeing only two pages makes you systematically underestimate competition — because the real threat may sit at page five and be climbing, and you cannot see it.
There is something subtler here too. When you can only see two pages, the statement “this market is not very competitive” is describing your observation range, not the market.
Gap three: sponsored and organic placements are routinely conflated
Most responses carry no field like isSponsored. So your rank tracker sorts ad placements and organic results into one sequence.
The result is a systematically distorted ranking metric. One team tracked a core keyword at a steady position three for four months, concluded that organic performance had plateaued, and prepared to increase ad spend. Once the sponsored flag was added and the data recomputed, the real picture was organic position one, with two competitors’ Sponsored Brands units inserted above it. Organic performance had been improving the whole time — the signal had been diluted by ad inventory, and the team believed they were standing still. Reversing the conclusion cut planned ad spend instead of raising it.
The inverse case is more common: a keyword that “ranks well” turns out to sit on page four, with the first three pages carpeted in competitors’ Sponsored Products and organic traffic close to zero.
Without a sponsored flag you cannot answer even the most basic question — what rank am I?
Gap four: variant-level attribution is missing
Do reviews, prices and inventory attach to the parent ASIN or the child? Most responses do not distinguish, or only give an aggregate.
The missing attribution makes insight unactionable. A typical case: review analysis surfaces a high-confidence finding that “users commonly complain about battery life.” It cannot be used. Which configuration has the short battery life? Is the complaint rate the same for the black version and the white one? Is one capacity tier the concentration point? Without attribution the response has to touch the entire product line — expensive and slow. With variant attribution the team localised it to one specific capacity tier, and the response went from “re-engineer the battery across the range” to “fix the specification copy and expectation setting on the low-tier model.” Cost dropped by an order of magnitude.
Gap five: cross-marketplace field alignment is badly underestimated
A field available on US may not be available on DE. Semantics on JP may not match US. Vendors rarely disclose per-marketplace field availability; they advertise “20+ marketplaces supported” and stop.
Multi-marketplace teams get burned here more than anywhere else. Everything tests fine domestically, the rollout reaches Europe, half the dimensions disappear from the dashboard, and only then does the vendor mention that certain fields are US-only. By that point the architecture has been designed around full coverage.
Gap six: nobody measures silent failure
The most expensive gap, because it generates no alert. HTTP 200, valid structure, all fields present — and the critical ones are null. Your monitoring reads status codes and sees green. Your dashboard counts rows and they are all there. Only the business side senses that “these numbers feel off lately,” without being able to say why.
Silent failure does not show up on the API bill. It shows up in decisions made on corrupted data. There is no ceiling on that cost and no invoice to audit.
Gap seven: nobody notifies you when a field changes
Almost nobody raises this one, and the rework it causes can exceed the previous six combined. Amazon’s pages change continuously, so a vendor’s schema has to follow — a field gets renamed, a type goes from string to object, an enum gains a value, two fields get merged.
The problem is that these changes land silently downstream. Your parser does not throw, because most fields are still there. Your validation does not fail, unless you explicitly validate that one path. A dimension quietly loses three months of data before anyone looks, and the investigation reveals the rename happened two months earlier.
There is no mature industry answer. Three things help, none of them complete. First, enforce existence and type checks on every field path at the ingestion boundary, so a type change raises rather than silently degrades. Second, subscribe the vendor changelog — if one exists — into your alerting channel, and if it does not, diff a saved sample response on a schedule. Third, put change notification into the contract; even a best-effort clause changes the conversation when something breaks.
One practical habit is worth calling out separately: keep a rolling archive of sample responses per data object. Not everything — a few dozen representative payloads per object, archived weekly. When the schema shifts, that archive is the only thing that lets you do root cause analysis rather than guesswork.
All seven gaps share one property: none of them appear on a feature grid, and none appear on a pricing page. The only way to find them is to measure. Here is how.
6. The alternative: a blind test you can reproduce
This is the most useful section of the article. It depends on no vendor’s self-description, and it does not require you to beg anyone for a field dictionary. Two days of work turns a shortlist of websites that all claim completeness into a table ordered by your own business requirements.
The idea in one line: write down what you need first, then see who can deliver it. The order matters. Most people read the vendor docs and reverse-engineer their requirements from them, which means the docs lead and you end up buying a pile of fields you never use while the one you needed is absent.

Step one: write the field contract, do not read the vendor docs
A field contract is your own requirements list, grouped by data object, with a priority on every field. P0 means the record is unusable without it. P1 means analysis gets shallower but still works. P2 is nice to have.
Below is a product-object contract template you can adapt. It covers the requirements we see most often in real projects; add and remove rows to suit your business.
| Group | P0 (critical) | P1 (important) | P2 (bonus) |
|---|---|---|---|
| Identity | asin, parentAsin, title, brand, categoryPath | modelNumber, manufacturer | browseNode, productType |
| Pricing | price.current, price.currency, price.original | price.unitPrice, price.isDeal | priceHistory |
| Promotions | — | coupon.amount, coupon.type, promotions[] | subscribeAndSave.discount |
| Availability | availability.status | availability.deliveryEstimate, seller.isFulfilledByAmazon | availability.shipFrom |
| Ratings | rating.value, rating.count | rating.histogram (1–5 star split) | reviewSummary |
| Rank | bsr[].category, bsr[].rank | multi-category BSR breakdown | BSR history |
| Variants | variants[].asin, variants[].price, variants[].availability | variants[].attributes (specification) | variants[].rating |
| Seller | seller.name, offerCount | seller.rating, seller.count, buyBoxWinner | seller.id |
| Ad placement | isSponsored, organicPosition | sponsoredType (SP / SB / SD) | sponsoredPosition |
| Badges | badges[] | isPrime | climatePledge, aPlusContent |
You need one of these per data object. For search, the fields that matter are page, items[].position (absolute position on the page), items[].isSponsored, items[].adType and items[].organicRank — without the last three, your rank tracker is sorting ads and organic results together. For reviews, they are reviewId, asin (the child), parentAsin, variant (specification text), rating, title, body, date, verifiedPurchase and helpfulCount. That variant field is what determines whether your review insight can be pinned to a specific configuration. The complete field dictionary with types is covered in the complete Amazon data API JSON schema and field dictionary.
Step two: design a sample set, do not use only bestsellers
Sample design determines whether the conclusion is trustworthy. The most common mistake is testing fifteen bestseller ASINs. Those products have the richest data available, so every vendor scores full marks and the test tells you nothing.
A sample set with discriminating power contains five kinds of record.
- Across categories — at least four top-level categories. Page templates differ substantially by category, and field availability follows.
- Across marketplaces — US plus at least two non-US. This is the direct test for gap five above.
- Heavy variants — products with twenty or more variants, to probe the depth of variant-level fields.
- Weak-data products — new listings with no reviews, long-term out-of-stock items, listings with no Buy Box. These are the litmus test for fill rate.
- Deep pages — for search, always test through page five. Two pages will not do.
On size: two hundred to five hundred records per vendor is enough for a stable result. Fewer and noise dominates; more and you are burning budget for nothing.
Step three: run it on identical terms
Four disciplines. Break any one of them and the numbers stop being comparable.
Same ASINs, same time window (compressed into a few hours where possible, to avoid natural price and stock movement), same concurrency level, same retry policy. The last one is the easiest to get wrong. If you give vendor A three retries and vendor B one, A’s usable rate is inflated and its real cost is three times what the test implies.
Step four: four metrics that take “supported” apart
Four numbers, all of them necessary.
| Metric | Formula | What it answers |
|---|---|---|
| Field coverage | contract fields returned ÷ total contract fields | Is the schema designed completely? |
| Non-null fill rate | contract fields with values ÷ contract fields returned | Is the field real, or decorative? |
| Usable record rate | records with all P0 present and coverage above threshold ÷ total records | How much of your spend bought usable data? |
| Cost per 1k usable records | period spend ÷ usable records × 1000 | The only price comparable across vendors |
The split between the first two matters a great deal. Coverage answers “does the field exist,” fill rate answers “did it come back with a value.” A vendor with 95% coverage and 60% fill rate is usually worth less to the business than one with 70% coverage and 98% fill rate. The first hands you a pile of nulls; the second hands you records that are solid end to end. Measuring coverage alone will mislead you badly.
The script below runs all four numbers. It flattens nested JSON into field paths, drops empty values, and validates against the contract.
import json, statistics

CONTRACT = {
    "P0": ["asin", "title", "price.current", "availability.status",
           "rating.value", "rating.count", "bsr", "variants"],
    "P1": ["parentAsin", "brand", "price.original", "price.currency",
           "coupon", "seller.name", "offerCount", "images",
           "badges", "isSponsored", "categoryPath"],
}

def flatten(obj, prefix=""):
    """Flatten to a.b.c paths; sample list items; empty values are dropped."""
    out = {}
    if isinstance(obj, dict):
        for k, v in obj.items():
            out.update(flatten(v, f"{prefix}.{k}" if prefix else k))
    elif isinstance(obj, list):
        for v in obj[:50]:
            out.update(flatten(v, f"{prefix}[]"))
    elif obj is not None and obj != "":
        out[prefix] = obj          # only non-empty lands here
    return out

def evaluate(record, cov_threshold=0.8):
    flat = flatten(record)
    contract = CONTRACT["P0"] + CONTRACT["P1"]
    present = [f for f in contract if f in flat]
    coverage = len(present) / len(contract)
    p0_ok = all(f in flat for f in CONTRACT["P0"])   # P0 must be 100% populated
    return {
        "coverage": round(coverage, 3),
        "usable": bool(p0_ok and coverage >= cov_threshold),
    }

def run(records, spend_usd):
    ev = [evaluate(r) for r in records]
    usable = [e for e in ev if e["usable"]]
    return {
        "samples": len(ev),
        "usable_rate": round(len(usable) / len(ev), 4) if ev else 0,
        "avg_coverage": round(statistics.mean(e["coverage"] for e in ev), 3),
        "cost_per_1k_usable": round(spend_usd / len(usable) * 1000, 2)
                              if usable else None,
    }
Feed the same records to every candidate and put each vendor’s actual spend in spend_usd. Line the four run() outputs up side by side and the decision usually makes itself. The process needs no cooperation from the vendor and no access to their field dictionary — you are measuring delivered output, not marketing material.
The script above is Python. Going from one working call to a job that runs every day — retries, rate limits, batching and failure monitoring — is covered in Amazon data API with Python.
Step five: classify failure four ways
Usable record rate tells you the aggregate, but not what to fix. So split the failures.
| Type | Symptoms | Visibility | Response |
|---|---|---|---|
| Hard failure | Non-200, timeout, connection error | Fully visible | Backoff and retry; sustained occurrence means change vendor |
| Soft failure | HTTP 200 but empty body or missing product | Half visible | Mark as missing; never count as usable |
| Partial failure | HTTP 200, valid structure, P0 fields null | Silent | The expensive one; only a field-contract check catches it |
| Stale data | Values present but clearly old | Silent | Record timestamps and monitor freshness |
The third row is the one to fear. It raises no error, trips no alert, and generates no billing dispute. It just quietly degrades your reporting. The p0_ok line in the script above exists specifically to catch it.
If your stack is Node.js or TypeScript, note that this kind of silent failure is one your type system will not catch — see Amazon data API with Node.js: the failures your types cannot catch.
Step six: make regression routine
A one-off acceptance test proves the thing works now. Vendor coverage drifts — page redesigns, policy changes, capacity shifts — and last month’s conclusion stops holding.
Run a fixed sample weekly (fifty to a hundred records is plenty, and cheap) and trend four numbers: median latency, p95 latency, usable record rate, average coverage. Chart them. When something trends downward you will see it before the business does. The effort is trivial, and it is the only way to turn a data vendor from a black box into a managed component.
7. What the framework reveals: where the gaps actually are
We are not going to publish a vendor ranking — that would put us right back in the problem criticised in section 2. What is more useful is telling you where the differences tend to show up once you run this, so you know where to look hardest in your own test.
Start with a pattern that repeats every time: feed the same ASINs to different vendors and the responses cluster into three clear shapes. Below are structural illustrations — real field naming conventions, example values.
Shape A — thin, roughly 12–18 fields
{
  "asin": "B0C7V9K2XQ", "title": "...", "brand": "...",
  "price": 49.99, "currency": "USD", "rating": 4.3,
  "reviewCount": 1284, "availability": "In Stock",
  "mainImage": "https://...", "bsr": 1842,
  "category": "Electronics", "url": "https://..."
}

Shape B — mid, roughly 30–40 fields, variants but no ad flags
{
  "asin": "B0C7V9K2XQ", "parentAsin": "B0C7V90001",
  "title": "...", "brand": "...", "manufacturer": "...",
  "price": {"current": 49.99, "original": 69.99, "currency": "USD"},
  "coupon": {"amount": 5.00, "type": "percentage"},
  "availability": {"status": "In Stock", "deliveryEstimate": "..."},
  "rating": {"value": 4.3, "count": 1284,
             "histogram": {"5": 62, "4": 21, "3": 9, "2": 4, "1": 4}},
  "bsr": [{"category": "Electronics", "rank": 1842},
          {"category": "Portable Audio", "rank": 97}],
  "variants": [
    {"asin": "B0C7V9K2XQ", "attributes": {"color": "Black", "size": "256GB"},
     "price": 49.99, "availability": "In Stock"},
    {"asin": "B0C7V9K2XR", "attributes": {"color": "White", "size": "512GB"},
     "price": 79.99, "availability": "In Stock"}
  ],
  "seller": {"name": "...", "rating": 4.6, "isFulfilledByAmazon": true},
  "images": [{"url": "...", "variant": "MAIN"},
             {"url": "...", "variant": "PT01"}],
  "badges": ["Amazon's Choice"]
}

Shape C — complete, with ad flags, organic rank, variant depth, deep-page position
{
  ... everything in shape B ...
  "variants": [
    {"asin": "B0C7V9K2XQ", "attributes": {"color": "Black", "size": "256GB"},
     "price": {"current": 49.99, "original": 69.99},
     "availability": "In Stock", "rating": {"value": 4.3, "count": 812},
     "isBuyBoxWinner": true, "offerCount": 7}
  ],
  "isSponsored": false, "organicPosition": 1,
  "searchContext": {"keyword": "...", "page": 1, "positionOnPage": 3,
                    "sponsoredCountAhead": 2,
                    "adTypesAhead": ["SB", "SP"]},
  "priceHistory": {"min90d": 44.99, "max90d": 69.99},
  "subscribeAndSave": {"discount": 5},
  "buyBoxWinner": {"seller": "...", "price": 49.99, "shipping": "FREE"}
}
On a feature grid these are the same checkmark. In your reporting, shape A supports price monitoring, shape B supports sourcing and variant analysis, and shape C is the only one that supports rank attribution and ad-competitive analysis. You are not just buying data. You are buying which questions you are allowed to ask.
The five places where vendors diverge most
After running this repeatedly, the differentiation almost always concentrates in five spots. If your own test time is limited, look here first.
Sponsored flags and organic rank. The single most discriminating item. Vendors carrying isSponsored and organicRank are a minority; most return only page position. Without it, rank tracking is guaranteed to be distorted.
Variant-level depth. Many vendors ship a variants array containing nothing but ASINs — no per-variant price, stock or rating. That tells you five variants exist without telling you which one is selling, which is out of stock, or which is losing rating.
Deep search pages. Little differentiation across the first two pages; sharp divergence from page three. Some vendors start returning duplicates, some return empty.
Promotions and coupons. Coverage of coupon, promotions and Subscribe & Save discounts is generally thin, yet these matter a lot for pricing decisions — list price alone systematically overstates what competitors actually transact at.
Seller and Buy Box detail. offerCount, buyBoxWinner and seller ratings are core metrics in heavily resold categories, and absent from many responses entirely.
Four cases: how a missing field becomes a business loss
Abstract numbers are less persuasive than specific situations. Four real project structures below, anonymised.
Case one: third place that was actually organic first. A consumer electronics brand tracked a core keyword at a steady position three for four months, read it as an organic ceiling, and prepared to raise ad spend. Recomputed with isSponsored applied, the truth was organic position one, with two competitors’ Sponsored Brands units sitting above it. Organic performance had been improving throughout; the signal had been diluted by ad inventory. After the conclusion flipped, planned ad spend went down rather than up. One boolean field put a quarter of budget decisions on an inverted premise.
Case two: page four, looking healthy. The inverse. A home goods brand’s keyword tracker reported strong positions while traffic kept sliding. Breaking the search response apart showed the first three pages carpeted in competitors’ Sponsored Products, with the brand’s organic listing on page four — pushed out of sight, while the old data source sorted ads and organic results together so the natural position still looked decent.
Case three: a review insight nobody could act on. A small appliance team’s review analysis produced a high-confidence finding: users commonly complain about battery life. It could not be actioned. Nobody knew which configuration fell short, or whether complaint rates differed between colourways. Changing the whole line was expensive and slow. Adding variant localised the problem to one capacity tier — concentrated in the low-spec model, near zero in the high-spec one. The response changed from “redesign the battery across the range” to “fix specification copy and expectation setting on the low tier.” Cost fell by an order of magnitude. Variant attribution is the field that takes an insight from plausible to executable.
Case four: coverage was great, fill rate was a disaster. A team evaluating vendors saw sixty-plus fields and 92% coverage, and signed an annual contract. Three months after launch the coupon dimension was empty in most reports and delivery estimates were empty in most reports — both fields present in the schema, both under 15% populated in practice. On an annual deal, switching mid-term was expensive. The lesson: run fill rate before signing, never just read the field list. Had they run the script from section 6, the line in flatten that drops empty values would have exposed it in minutes.
8. Where Pangolinfo sits against this standard
The seven preceding sections tried to stay neutral, because a methodology should not be contaminated by the identity of whoever is publishing it. This section states our own position — and, just as importantly, what we do not do.
Using the section 6 framework’s own terms, we put our field-completeness effort into the places the industry generally handles poorly.
Ad placement detection is where we have invested most. isSponsored, sponsoredType (distinguishing SP, SB and SD) and organicRank are standard fields in our search and product responses, not optional extras. What backs it is ad-placement collection across thirteen marketplaces, at a publicly stated overall collection rate of 91.4%. The significance is simple: it makes the rank metric trustworthy again. The distortions in cases one and two cannot occur in this response shape.
Variant-level data is modelled properly, not bolted on. Every variant carries its own ASIN, specification attributes, price, stock, rating, Buy Box attribution and offer count. Parent and child ASINs are both returned, so aggregation and drill-down both work. The “insight cannot be pinned to a configuration” problem in case three has its root cause right here.
Search results go deep. The first two pages carry limited value for competitive density assessment. Our responses reach further down the page range, and they give absolute page position and organic position separately rather than conflating them.
Two engineering figures for reference: roughly three seconds median latency, 99% success rate. We would rather you re-measure both than take them from us — the framework in section 6 exists precisely so you can.
What we explicitly do not cover. Account-domain data — orders, inventory, your own listing performance — belongs to the official SP-API’s authorisation scope. We do not provide it and we do not provide a way around it. We do not collect buyer personally identifiable information. We do not collect anything behind a login. These are not gaps on a roadmap; they are design boundaries. If your requirements sit entirely in the account domain, connecting the SP-API directly is the right answer and we cannot help you.
Compliance is not only about what you collect. What you do with the data after it lands — classification, minimisation, retention and deletion — decides whether it is fit for commercial use. We covered those four controls in the Amazon data API compliance checklist.
One more thing worth saying plainly: run this blind test on us too, alongside everyone else on your shortlist. Field completeness only means something once the buyer has measured it. Numbers a vendor reports about itself — ours included — deserve to be verified.
9. Recommendations by scenario, not a ranking
What follows is actionable rather than a leaderboard. Not who is first, but which road to take in which situation.
| Your situation | Recommended route | Why |
|---|---|---|
| Only your own operational data (orders, inventory, fulfilment, your ads) | Official SP-API | The only compliant source, accuracy unmatched; no third party can supply it |
| Market data, with a dedicated parser maintainer and needs beyond every existing schema | General scraping API plus your own parsing | Widest reach, no schema ceiling — but price in the ongoing headcount |
| Market data, want it working out of the box, no parsing team | Vertical Amazon data API | Vendor absorbs redesigns; scrutinise ad flags, variants and deep pages |
| Historical trends, model training, baselines | Offline dataset plus real-time API increment | Dataset for depth, API for now; confirm both share one schema |
| Both account and market domains (most common) | SP-API plus a vertical data API in parallel | The two barely overlap; unify them with a shared access layer |
| AI agents fetching data directly | Dual channel: REST API plus MCP | REST for pipelines, MCP for agents; one shared field contract |
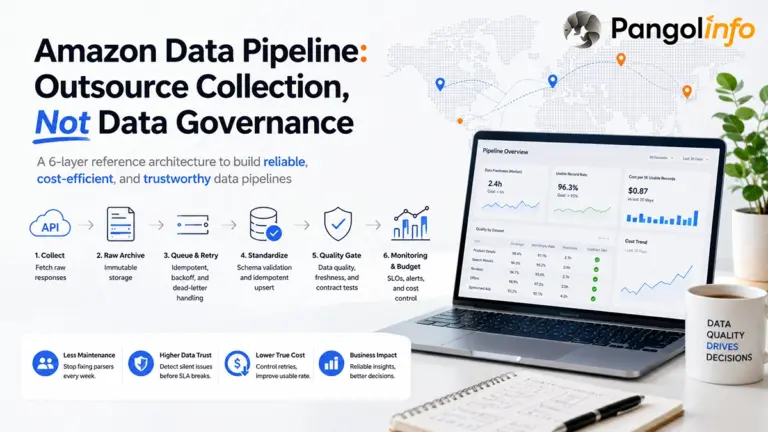
That last row deserves a note. Agent access and programmatic access are two different workflows, not two wrappers on one endpoint. A REST API serves pipelines — batch, replayable, with explicit failure semantics. MCP serves conversation — on demand, single record, requiring fields that carry their own meaning. Sharing one field contract is what keeps the two sides semantically aligned. Turning the REST side into a daily batch pipeline with validation and retry is covered in building an Amazon data pipeline.
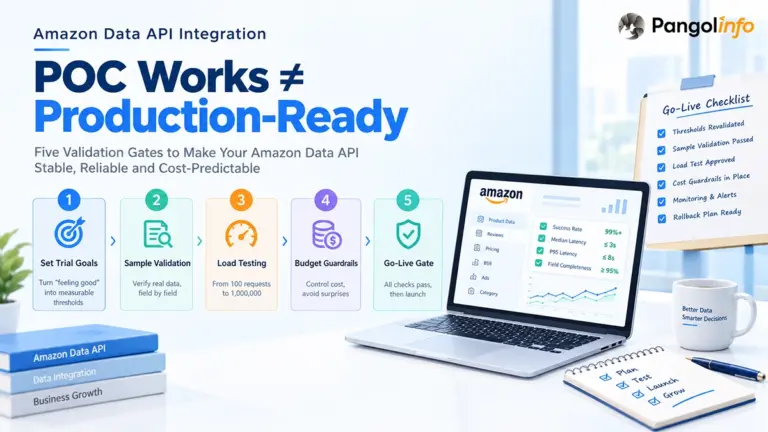
10. Pre-launch acceptance checklist
Whichever vendor you land on, work through these seven before going live. They share one property: every one of them can be completed before signing, and every one can be automated with the section 6 script.
- The field contract is written down, with P0 / P1 / P2 priorities agreed by the business side — not invented by an engineer.
- The sample set covers all five record types: cross-category, cross-marketplace, heavy variants, weak-data products, deep pages.
- Four or more vendors ran the blind test, on identical terms — same ASINs, same window, same concurrency, same retry policy.
- All four numbers are in hand: coverage, fill rate, usable record rate, cost per thousand usable records. Missing any one, you cannot compare price.
- Failures are classified, with the partial-failure share (P0 nulls) confirmed — the only class that needs dedicated code to detect.
- Quotas and rate limits are modelled per operation type, with backoff behaviour tested against real quotas.
- Regression is scheduled: a fixed sample weekly, with all four numbers trended on a chart.
Item seven is the easiest to skip and the most valuable. A one-off acceptance test proves it works today. Weekly regression is what proves it keeps working.
Frequently asked questions
Which is the best Amazon data API?
There is no universally best option, only the best fit for your data domain. If you only need your own operational data, the official SP-API is the only compliant choice. For competitor and market data, compare field completeness, usable record rate and cost per thousand usable records rather than feature checkboxes and entry pricing.
Why do Amazon data API comparison tables all look the same?
Most tables use a binary checkbox for support, so a vendor returning eight fields and one returning sixty both count as supporting product data. What actually separates them is field coverage, non-null fill rate and deep-page availability, none of which survive a checkbox grid.
How do you tell whether an Amazon data API returns complete fields?
Write a field contract listing what your business requires, then run the same set of ASINs across vendors and measure field coverage, non-null fill rate and usable record rate. High coverage with low fill rate means fields exist but come back empty, which is equally unusable.
Is the official SP-API the best choice?
It depends on the data domain. The SP-API covers orders, inventory and your own listings, and is the only authorised source for those. It does not provide competitor prices, search rankings, reviews or sponsored placements. Most teams with both needs run the two side by side.
What cost is most often underestimated when choosing an Amazon data API?
Not the subscription fee, but the rework and bad decisions caused by silent failures. Records that return HTTP 200 with critical fields missing never trigger a billing dispute, yet they quietly corrupt downstream reports. Measure effective cost per thousand usable records, not per request.
External references: Amazon Selling Partner API official documentation (authorisation model and per-operation rate limiting), Amazon conditions of use and robots guidance, published Pangolinfo service metrics.
Next step: write your field contract using section 6, then shortlist candidates against the five divergence points in section 7. For public product and search objects, start with Amazon Scraper API; for review workloads, Amazon Review API; to let agents fetch data directly, Amazon Data MCP. You can grab an API key from the console and run a blind test, or read the Amazon Data MCP documentation. For the broader selection framework, see Amazon Data API: The Complete Buyer’s Guide.