
Article Summary
Amazon category competition analysis is the critical first step before any product launch — but mainstream SaaS tools are fundamentally limited by 3-7 day data lag, homogenized insights shared by tens of thousands of sellers, and fragmented metrics requiring $300-500/month in stacked subscriptions. This article introduces a 5-dimension scoring framework (BSR Concentration, Review Barrier, CPC Benchmark, New Product Survival Rate, Seller Density) and demonstrates how to implement it through Pangolinfo’s Amazon Scraper API, Amazon Data MCP, and Amazon Scraper Skill — creating an automated, real-time competition monitoring system that replaces daily manual BSR checking.
Your Amazon Category Competition Analysis Method May Already Be Obsolete
Here’s a direct benchmark: if a subcategory’s Top 10 ASINs capture more than 60% of sales, the top three listings average over 800 reviews, and core keyword CPC exceeds $2.00 — you’re looking at a near-impenetrable competitive moat. New product survival rates in categories like these fall below 15%. These aren’t abstract thresholds from a white paper. They’re numbers we derived from analyzing hundreds of categories at Pangolinfo against real-time data.
But the more important question is: when you see those numbers, are they from today or from three days ago? Are they pulled from a SaaS database refreshed monthly, or from pages scraped last night?
According to Marketplace Pulse’s 2025 data, the number of active Amazon sellers dropped from a 2021 peak of 2.4 million to approximately 1.65 million — but the sellers who remain are becoming dramatically more sophisticated. The number of sellers generating over $1 million annually grew from roughly 60,000 to more than 100,000. The market is culling those who rely on outdated analysis methods while rewarding those who can read competitive dynamics faster, more accurately, and more systematically.
Amazon category competition analysis isn’t a one-time exercise. It’s a continuous dynamic judgment that needs constant updating. This article breaks down the real limitations of existing tools and lays out an automation-ready solution that teams can actually run.
Why Mainstream Amazon Competition Analysis Tools Are Leading Everyone Into the Same Trap
Before any solution, the problem needs to be clearly diagnosed. Most articles skip this step, but understanding exactly where current tools fail is the only way to appreciate what a better approach delivers.
What tools currently exist for Amazon niche competition assessment?
The current landscape breaks into three categories. First, full-suite SaaS platforms — Helium 10, Jungle Scout, and SellerSprite (卖家精灵) — offering category databases, opportunity scores, and keyword analysis in one subscription. Second, specialized tools: Keepa for historical BSR and pricing curves, SmartScout for brand market share analysis. Third, Amazon’s own Product Opportunity Explorer, which provides click share, return rate, and demand-side signals from inside the platform.
Each has real value. Jungle Scout’s 2025 State of the Amazon Seller report found that 80% of sellers now use AI-enhanced tools in their operations, suggesting near-universal adoption. But the adoption problem is exactly the problem.
The homogenization trap: when everyone uses the same intelligence
When tens of thousands of sellers use the same tool, look at the same metrics, and reach the same “high demand, low competition” conclusion — that conclusion loses its predictive value entirely. It’s a textbook observer effect: the tool changes the market it’s measuring.
Sellers operating at scale have described it concisely: they find a “high-opportunity” category in Helium 10, launch a product, and discover the actual competition is far more intense than the tool suggested. The reason is straightforward — the tool’s data was a historical snapshot captured days ago, while competitors had already flooded the category in the interim. Most major SaaS platforms refresh category-level data every 3-7 days; some metrics update even less frequently.
Data lag is a structural problem, not an optimization issue
There’s a fundamental technical reason this can’t be fixed by adding engineering resources: SaaS tools maintain pre-computed databases that batch-refresh on schedules to control costs. What you see as “today’s competition score” is a frozen slice of a past moment. For teams making fast product decisions, a three-day data lag means you’re analyzing a “low competition” snapshot while a dozen competitors are already preparing to launch. Jungle Scout reports that nearly 50% of sellers express significant concern about market encroachment from new entrants — anxiety driven partly by the tool ecosystem’s inability to provide genuinely current data.
Metric fragmentation and subscription cost stacking
The other hidden cost is the tool bill itself. Running a reasonably complete Amazon category competition analysis typically requires: Helium 10 ($99-249/month) + Keepa ($19/month) + SmartScout or SellerSprite ($49-149/month) — easily $300+ per month. These tools don’t fully align on data definitions or update timing, requiring manual reconciliation that adds further hidden time cost. This is why sophisticated sellers and SaaS development teams increasingly look toward raw API access — using their own analytical logic on fresh data rather than inheriting a vendor’s pre-configured framework.
The 5-Dimension Framework for Quantifying Amazon Category Competition Intensity
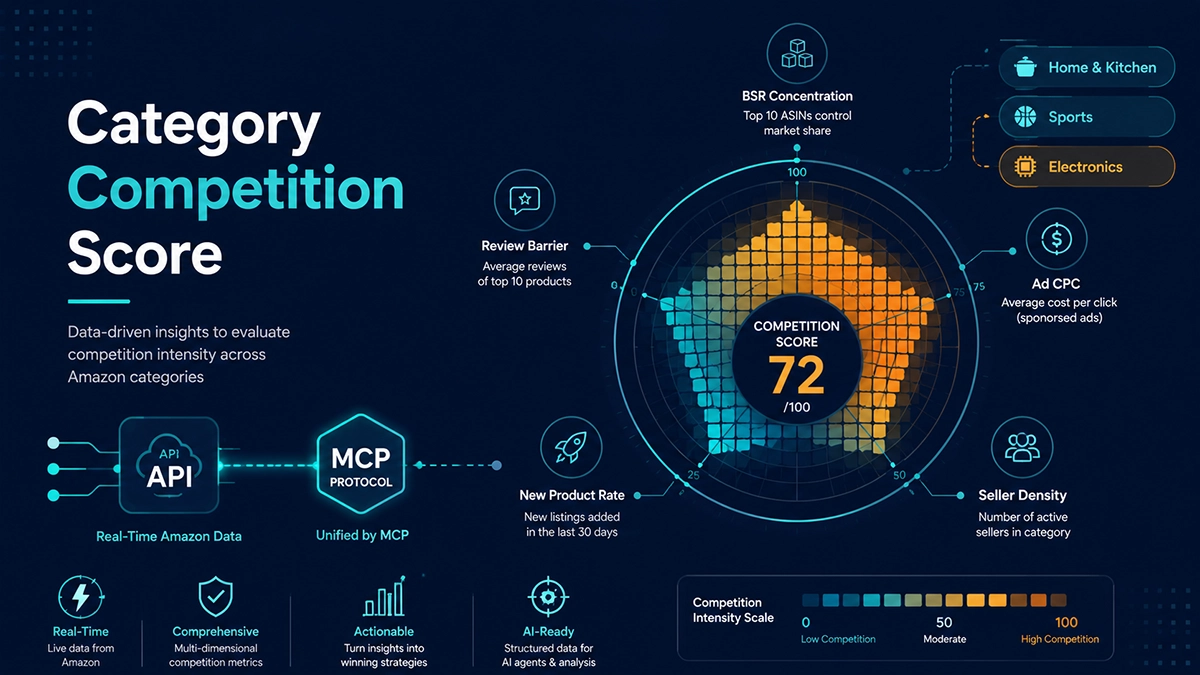
Any automation-ready solution needs a rigorous analytical framework first. Here’s the 5-dimension scoring model we use at Pangolinfo, with specific thresholds derived from real category data:
Dimension 1: BSR Concentration (Head Brand Share)
Formula: Top 10 ASIN estimated sales ÷ Top 100 total estimated sales. This measures whether a few dominant players control the category’s economics. Thresholds:
- ≤45%: Fragmented market, new products have realistic entry paths (low intensity)
- 45%-60%: Head advantage exists but no absolute moat (moderate competition)
- >60%: Dominant positions with high switching costs for buyers (high intensity)
Dimension 2: Review Barrier
Average review count of the top 5 listings on the primary search results page. BrightLocal’s 2024 consumer research found that 93% of shoppers read reviews before purchasing — review count has become a trust signal as much as a ranking factor. Thresholds:
- <300 reviews: Catchable within 6 months of a quality launch (accessible)
- 300-1,000 reviews: 6-18 months needed to reach competitive parity (moderate barrier)
- >1,000 reviews: Near-impossible to close the gap in a standard launch window (high barrier)
Dimension 3: Ad CPC Benchmark
Average CPC for core category keywords directly reflects the monetized cost of buyer attention. Categories where CPC exceeds $2.50 indicate that advertising arbitrage margins have been compressed by well-capitalized competitors. New entrants without significant ad budgets struggle to survive the launch phase.
Dimension 4: New Product Survival Rate
Percentage of listings in the category Top 100 that launched within the past 90 days. This is the most direct indicator of whether a market’s ranking structure is still fluid. Below 10% means the category is locked; above 25% signals active iteration where new products still win placements.
Dimension 5: Seller Density Index
Effective competitor count (listings with active Buy Box, excluding Amazon Retail) in primary search results, normalized against monthly search volume. Higher density means thinner organic traffic distribution per competitor.
Applying weighted scoring across these 5 dimensions (BSR Concentration 30%, Review Barrier 25%, CPC 20%, New Product Survival 15%, Seller Density 10%) produces a 0-100 competition intensity score. Below 30 indicates blue ocean opportunities; 30-60 requires meaningful differentiation; 60+ warrants focused niche targeting or reconsideration.
The Actionable Solution: Pangolinfo API + MCP + Skill Three-Layer Architecture
With the framework defined, the question becomes: where does the raw data come from, how is it automated, and how can an AI Agent trigger the entire process on demand? Here are three progressively capable implementation tiers, scalable to different technical team sizes.
Layer 1: Amazon Scraper API — Real-Time Raw Data Collection
The Pangolinfo Amazon Scraper API is the foundational data layer. Unlike SaaS pre-computed databases, the Scraper API performs live page fetches — every call returns data from what Amazon is actually serving at that moment, with no time-window lag. For competition analysis, the core endpoints needed are:
- Category Best Sellers pages (extract Top 100 ASINs, BSR ranks, sales estimates)
- Search result pages (extract ad slot count, organic ranking ASINs, CPC benchmarks)
- Product detail pages (extract review counts, rating distribution, listing age, seller info)
In Pangolinfo’s production environment (30M+ calls/day), success rates hold at 99%+. The API supports zip-code-level targeting, critical for cross-border teams who otherwise receive pricing and ranking data biased toward a data center’s geography rather than their actual customer demographics.
Layer 1 Implementation: Python Code Sample
import requests
import json
from datetime import datetime

API_KEY = "your_pangolinfo_api_key"
BASE_URL = "https://api.pangolinfo.com/v1"

def get_category_top100(category_url: str) -> dict:
    """Fetch Amazon category Top 100 data for competition analysis"""
    payload = {
        "url": category_url,
        "render": True,
        "extract": "structured"  # Returns structured JSON, no HTML parsing needed
    }
    response = requests.post(
        f"{BASE_URL}/amazon/bestsellers",
        json=payload,
        headers={"Authorization": f"Bearer {API_KEY}"}
    )
    return response.json()

def compute_competition_score(top100_data: dict, keyword_data: dict) -> dict:
    """
    Compute category competition intensity using 5-dimension weighted scoring
    Returns 0-100 composite score with per-dimension breakdown
    """
    products = top100_data.get("products", [])

    # Dimension 1: BSR Concentration
    total_sales = sum(p.get("sales_estimate", 0) for p in products)
    top10_sales = sum(p.get("sales_estimate", 0) for p in products[:10])
    bsr_concentration = (top10_sales / total_sales * 100) if total_sales else 0
    bsr_score = min(100, bsr_concentration * 1.4) if bsr_concentration > 45 else bsr_concentration

    # Dimension 2: Review Barrier
    top5_reviews = [p.get("review_count", 0) for p in products[:5]]
    avg_reviews = sum(top5_reviews) / len(top5_reviews) if top5_reviews else 0
    review_score = min(100, avg_reviews / 10)

    # Dimension 3: Ad CPC Pressure
    avg_cpc = keyword_data.get("avg_cpc", 0)
    cpc_score = min(100, avg_cpc / 3.0 * 100)

    # Dimension 4: New Product Survival (inverted — low survival = high competition)
    new_count = sum(1 for p in products[:100] if p.get("listing_age_days", 999) <= 90)
    survival_rate = new_count / min(len(products), 100)
    survival_score = max(0, 100 - survival_rate * 400)

    # Dimension 5: Seller Density
    seller_count = keyword_data.get("organic_result_count", 0)
    monthly_searches = keyword_data.get("monthly_search_volume", 1)
    density_ratio = seller_count / (monthly_searches / 1000)
    density_score = min(100, density_ratio * 10)

    # Weighted composite score
    weights = {"bsr": 0.30, "review": 0.25, "cpc": 0.20, "survival": 0.15, "density": 0.10}
    final_score = (
        bsr_score * weights["bsr"] +
        review_score * weights["review"] +
        cpc_score * weights["cpc"] +
        survival_score * weights["survival"] +
        density_score * weights["density"]
    )

    if final_score < 30:
        label = "Blue Ocean Opportunity"
    elif final_score < 60:
        label = "Moderate Competition"
    else:
        label = "High Competition — Proceed with Caution"

    return {
        "competition_score": round(final_score, 1),
        "label": label,
        "dimensions": {
            "bsr_concentration": round(bsr_score, 1),
            "review_barrier": round(review_score, 1),
            "ad_cpc": round(cpc_score, 1),
            "new_product_survival": round(survival_score, 1),
            "seller_density": round(density_score, 1)
        },
        "timestamp": datetime.now().isoformat()
    }

# Example usage
if __name__ == "__main__":
    category_data = get_category_top100(
        "https://www.amazon.com/Best-Sellers-Home-Kitchen/zgbs/home-garden/"
    )
    keyword_data = {
        "avg_cpc": 1.8,
        "monthly_search_volume": 45000,
        "organic_result_count": 3200
    }
    result = compute_competition_score(category_data, keyword_data)
    print(json.dumps(result, indent=2))
    # Output: {"competition_score": 47.3, "label": "Moderate Competition", ...}
Layer 2: Amazon Data MCP — Direct AI Agent Integration
For teams using Claude, Cursor, or custom AI agents, the Pangolinfo Amazon Data MCP lets agents query Amazon data in natural language without writing API requests manually. MCP (Model Context Protocol), standardized by Anthropic, allows LLMs to invoke data tools the same way a developer calls a function. Configure it once:
{
  "mcpServers": {
    "pangolinfo-amazon": {
      "command": "npx",
      "args": ["-y", "@pangolinfo/amazon-data-mcp"],
      "env": {
        "PANGOLINFO_API_KEY": "your_api_key_here"
      }
    }
  }
}
After setup, simply tell your agent: “Analyze the competition intensity of the home storage category over the past 48 hours, focusing on BSR concentration changes and new product entry rate.” The agent automatically triggers data collection, runs the scoring model, and returns a structured analysis report — without any manual intervention.
The fundamental difference from traditional SaaS tools: MCP triggers on-demand real-time collection, meaning every query is answered with current data. SaaS tools serve pre-cached results from their last database refresh. In fast-moving categories, this temporal gap is a material decision-making disadvantage.
Layer 3: Pangolinfo Amazon Scraper Skill — Deep Workflow Integration
For developers building e-commerce AI agent workflows, the Pangolinfo Amazon Scraper Skill packages the data layer as an Open Claw-compatible Agent Skill, ready for insertion into multi-step orchestration pipelines.
A practical daily workflow looks like this: every night at 2 AM, a product selection agent runs automatically — Step 1 uses the Scraper Skill to pull Top 100 data for 20 target categories; Step 2 applies the scoring model to rank all categories by competition intensity; Step 3 triggers deep analysis for “Blue Ocean” candidates (extracting negative review clusters, price band distribution, seasonal demand signals); Step 4 pushes the structured report to a Feishu/Slack channel ready for the team’s morning review. Zero human touchpoints between data collection and insight delivery.
Solution Comparison: Three Layers vs. Traditional SaaS
| Solution Layer | Technical Complexity | Best For | Data Freshness | Core Advantage |
|---|---|---|---|---|
| Scraper API + Python | Medium (dev required) | Technical sellers, SaaS builders | Real-time (on-demand) | Fully custom scoring logic |
| Amazon Data MCP | Low (config-ready) | AI agent users, ops teams | Real-time (agent-triggered) | Natural language, zero-code |
| Amazon Scraper Skill | Medium-High (workflow orchestration) | E-commerce AI developers | Real-time (scheduled auto-trigger) | Full automation, no human touchpoint |
| Traditional SaaS (Helium 10, etc.) | None (plug-and-play) | Beginning sellers | 3-7 day lag | Friendly UI, but heavily homogenized |
Why Pangolinfo Has a Structural Advantage for Competition Analysis
This isn’t a claim that SaaS tools have no value — they do, especially for sellers doing occasional ad-hoc research. But for teams that need to continuously monitor multiple categories, react quickly to market shifts, or integrate competition intelligence into automated decision pipelines, the API approach’s advantages become non-negotiable.
First: raw data fidelity. Pangolinfo returns data directly from Amazon pages as structured JSON or raw HTML — no intermediate aggregation, no smoothing. This means you see real BSR fluctuations, including short-window anomalies that indicate emerging opportunities. Traditional tools average these variations away as “noise,” which often means filtering out the most actionable signals.
Second: analytical exclusivity. A scoring model built on your own logic is a proprietary competitive asset. The “opportunity score” inside a shared SaaS tool is public intelligence available to every one of their tens of thousands of subscribers simultaneously. One is a moat; the other is a crowded street corner.
Third: cost structure optimization. At meaningful scraping scale, API marginal costs drop significantly below the combined fixed cost of stacking multiple SaaS subscriptions. For SaaS companies building seller tools and for data service teams, this also means better data ownership and lower platform dependency risk.
On the technical side, Pangolinfo’s Sponsored Products ad slot capture rate hits 98% — an industry-leading figure in a domain where Amazon’s anti-bot infrastructure is increasingly aggressive. This matters specifically for the CPC and ad competition dimension of category analysis, where accurate ad slot visibility is essential.
Move Beyond Snapshot Thinking: Amazon Category Competition Analysis Needs a Live System
The core question in Amazon category competition analysis was never “which tool is better.” It’s whether your analysis system has sufficient time resolution, whether it runs proprietary logic, and whether it integrates into a larger automated decision workflow.
Existing SaaS tools remain useful for entry-level product research, but for professional category monitoring and AI agent-driven automated decisions, their data lag and homogenized insights represent a clear ceiling. The progression from the 5-dimension framework, to API automated data collection, to MCP-driven natural language agent queries, is a layered adoption path — not an all-or-nothing switch. Start with the Scraper API and a Python script to validate whether the framework produces actionable signals for your specific categories. Then scale to MCP and Skill integration as the workflow matures.
How well you do Amazon category competition analysis ultimately shows up in your product launch win rate. The more real-time the data, the more differentiated the analysis, the more automated the process — the higher the win rate.
📌 Get started: Apply for the Pangolinfo Amazon Scraper API, or connect your AI agent to live Amazon data through the Amazon Data MCP.
Frequently Asked Questions
How do you quantify Amazon category competition intensity?
Competition intensity can be quantified across 5 dimensions:
(1) BSR Concentration — if Top 10 ASINs capture over 60% of category sales, the market is heavily consolidated;
(2) Review Barrier — average review count of top 3 listings;
(3) CPC Benchmark — average cost-per-click for core keywords;
(4) New Product Survival Rate — what percentage of listings in the Top 100 were launched in the past 90 days;
(5) Seller Density Index — effective competitor count relative to search volume. These dimensions are weighted to produce a 0-100 competition score.
What BSR concentration level signals excessive competition?
Based on Pangolinfo’s analysis of hundreds of Amazon categories: when the Top 10 ASINs capture more than 60% of category sales and those listings average 500+ reviews, the category has a defensible moat. New entrants should target categories where BSR concentration is below 45% and top competitors show concentrated negative reviews (15%+ one or two-star ratings), indicating product improvement opportunities.
What are the core limitations of existing Amazon competition analysis tools?
Three fundamental problems: (1) Data lag of 3-7 days makes it impossible to capture real-time BSR movements; (2) Analysis homogenization — tens of thousands of sellers using identical tools reach identical conclusions, flooding the same opportunities simultaneously; (3) Metric fragmentation requiring multiple tool subscriptions ($300-500/month combined) that still fail to cover all needed dimensions.
How can you automate Amazon category competition scoring with an API?
Using the Pangolinfo Amazon Scraper API, you can fetch real-time Top 100 BSR, review counts, pricing, and ad slot data from any category page. A Python script applies the 5-dimension weighted scoring model to output a competition intensity score (0-100) with category labels. The entire pipeline can be scheduled to run automatically, replacing daily manual BSR monitoring.
How do you connect Pangolinfo MCP to an AI Agent for competition analysis?
Pangolinfo Amazon Data MCP provides an MCP-protocol data layer compatible with Claude, Cursor, and custom AI agents. After a one-time configuration, agents can respond to natural language commands like “analyze competition changes in the home storage category over the past 48 hours” — automatically triggering data collection, scoring calculation, and structured report output with no manual steps.
📊 Amazon category competition analysis shouldn’t rely on manual BSR checking or stale cached data.
→ Get the Amazon Scraper API and run your first competition scoring script today
→ Connect Amazon Data MCP and let your AI Agent handle daily competition monitoring
→ Access the Pangolinfo Console for API quota and documentation(Check the MCP Integration Documentation)
About Pangolinfo: We build Amazon data infrastructure — real-time scraping APIs, MCP-protocol data layers, and Agent Skills — for e-commerce sellers, SaaS teams, and data service providers. Published: 2026-07-15