
Series Navigation: This article is Part 3 (A3) of our 4-part series on AI-driven product validation, serving as the scoring methodology companion to our pillar guide, the Amazon Niche Discovery Workflow Guide. For the 28-column data schema and static tables, refer to Part 1 (A1), the Amazon Niche Discovery Workflow Template (published 2026-11-07); for the live five-step prompt execution, see Part 2 (A2), the Step-by-Step Amazon Niche Research Workflow with AI (published 2026-11-08). The series concludes in Part 4 (A4), the Amazon Product Research Prompt Pack (coming soon).
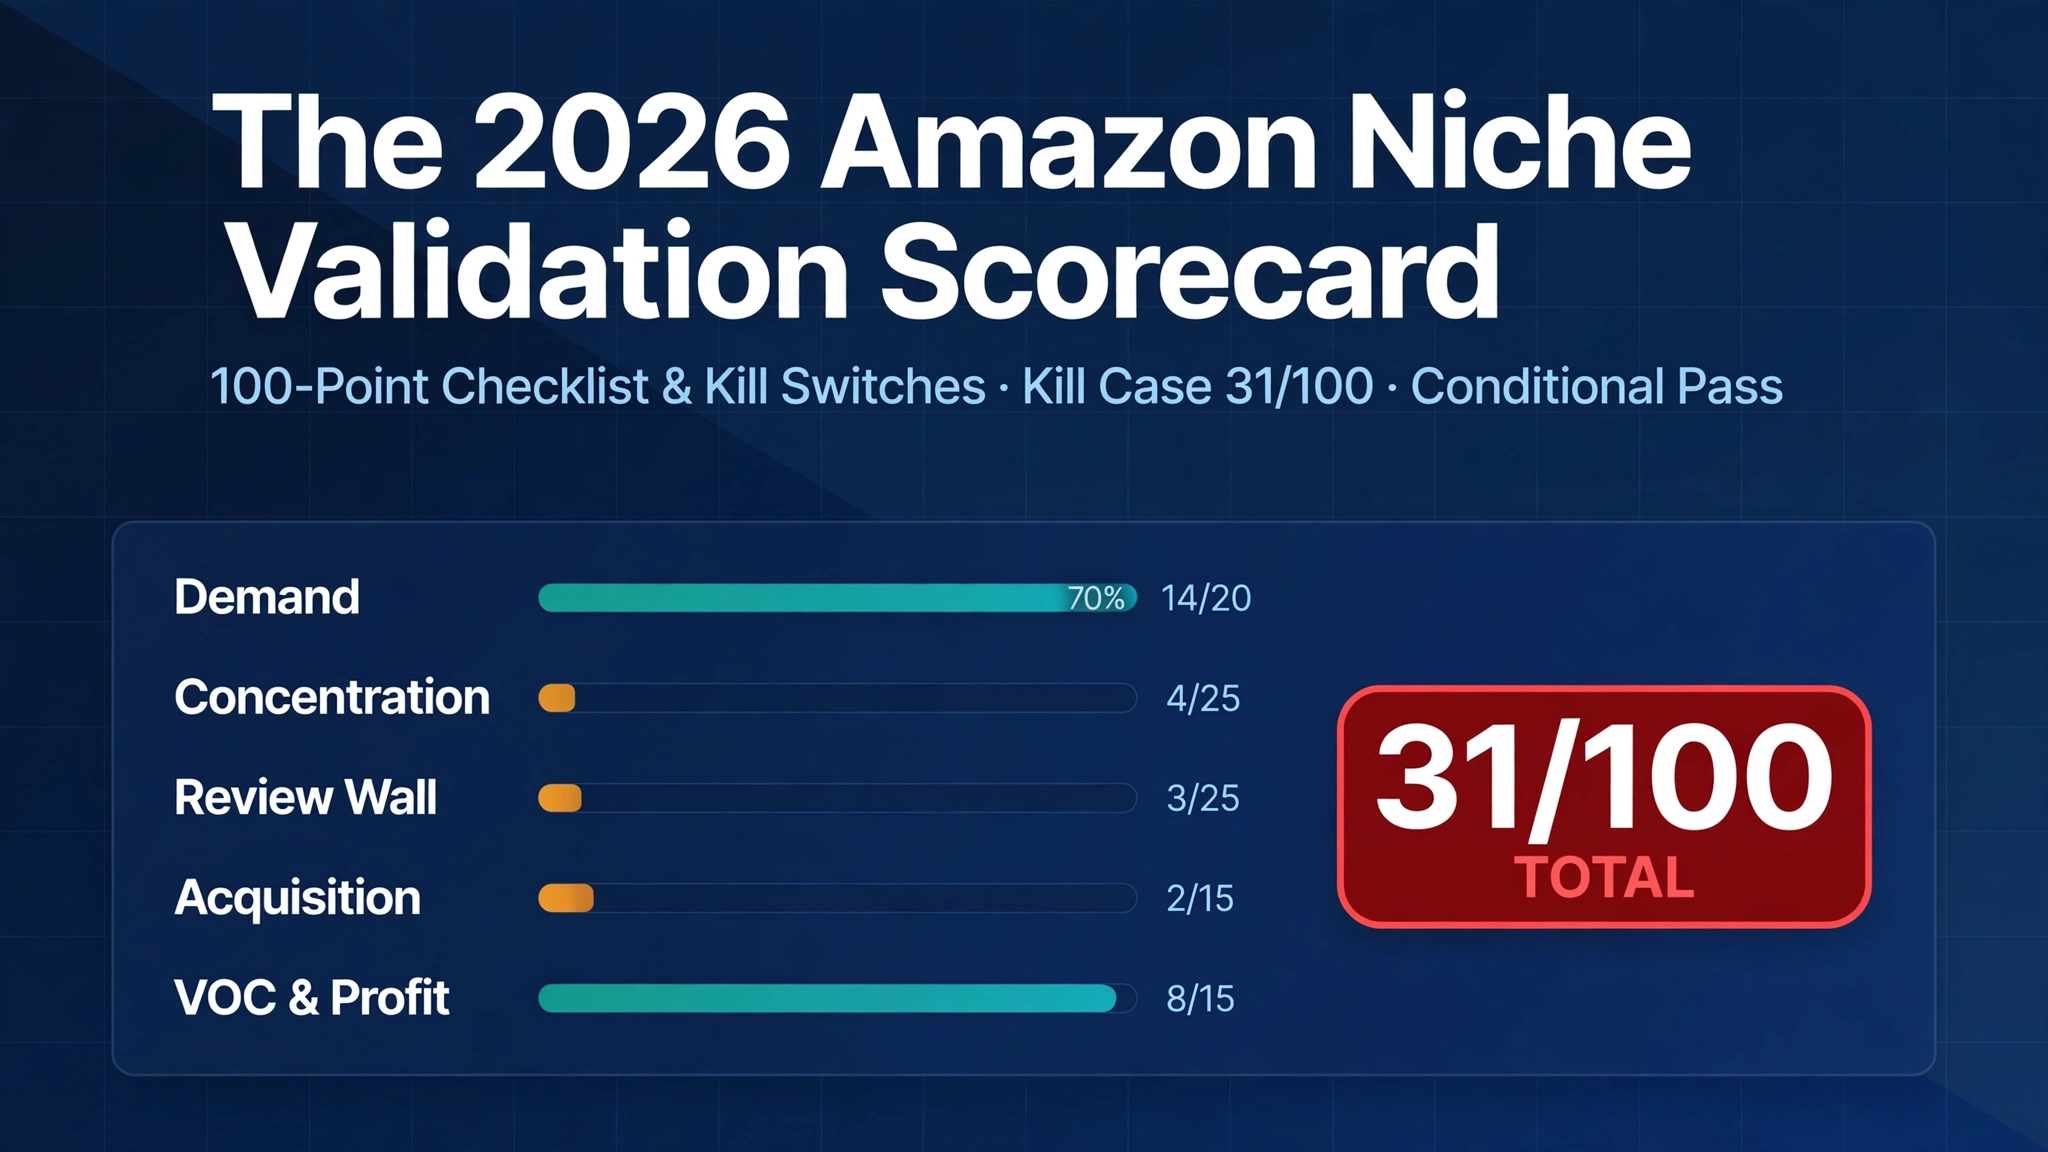
Applying our amazon niche validation scorecard and checklist 2026 to ~35 screened niches yielded zero clean passes: the kill case lick mat for dogs scored 31/100 and triggered 4 Kill Switches (verdict: CAUTION leaning STOP, do not launch), while the closest viable candidate, rizz em with the tism shirt, earned only a CONDITIONAL GO with 4 of 5 dimensions clean and brand concentration flagged amber at 44.3%.
Most product research post-mortems trace failed launches back to a single methodological flaw: relying exclusively on either an unconstrained point total or a rigid binary checklist. In Part 1 (A1), the Amazon Niche Discovery Workflow Template, we introduced the 28-column data architecture, the 5 Kill Switch reference table, and the 13-point pre-order checklist. In Part 2 (A2), the Step-by-Step Amazon Niche Research Workflow with AI, we demonstrated how to execute those pulls inside a 60-minute timebox using English prompts. We will not reprint A1’s 28-column schema or A2’s five-step prompt scripts here. Instead, Part 3 dives exclusively into the mathematical and operational mechanics of the scoring methodology itself: why weighted scoring must operate alongside hard Kill Switches, how our thresholds were calibrated against live 2026 catalog conditions, and how two real audited cases—one decisive kill and one conditional pass—behave under the rubric.
1. Scorecard Overview: Why Weighted Scoring Is Not the Opposite Extreme of Kill Switches
Sellers designing an amazon niche validation scorecard and checklist 2026 frequently fall into a false dichotomy. One camp relies on pure weighted additive scoring, summing points across demand, competition, and price into a single 0-to-100 index. The opposing camp relies on strict binary pass/fail filters, rejecting any keyword that misses a single textbook benchmark. Both extremes fail when exposed to live Amazon marketplace data.
Pure weighted additive models suffer from compensatory masking. In a strictly additive rubric, explosive search volume growth and high buyer dissatisfaction can mathematically offset a fatal structural flaw—such as a 95% sponsored ad wall or a 0% 90-day new-launch survival rate. An operator sees a middling total score, assumes the niche merely needs better marketing or a slight product tweak, and wires a factory deposit into a monopolized category where new entrants cannot buy profitable traffic. Conversely, pure binary checklists suffer from false-negative paralysis. As we discovered when screening roughly 35 candidate niches in the 2026 US catalog via the Niche Data API, mature Amazon subcategories rarely satisfy every textbook ideal simultaneously. If you demand that Top-5 brand click share sit strictly below 40% while simultaneously requiring zero ad crowding, high average prices, and rapid growth, your pipeline returns zero qualifying products.
The solution is a dual-gate architecture that pairs Five-Dimension Weighted Scoring (100 points total) with Five Non-Compensatory Kill Switches (KS-01 through KS-05). Weighted scoring measures continuous commercial attractiveness and capital efficiency, while Kill Switches enforce non-negotiable survival boundaries.
To run this dual-gate scoring engine without manual spreadsheet calculation errors, product teams wire WorkBuddy directly to the Amazon Data MCP. The MCP server exposes 21 live tools over a remote endpoint (https://mcp.pangolinfo.com/mcp), maintaining a 99.9% request success rate and 90%+ sponsored-placement detection accuracy on live search pages. Full client setup instructions are covered in the WorkBuddy Amazon Data Skill Guide. Before running the scorecard calculations below, ensure your WorkBuddy client mounts the MCP server using this exact configuration block (replace the placeholder with your private token; never hardcode a live key):
{
  "mcpServers": {
    "pangolinfo-amazon-data": {
      "url": "https://mcp.pangolinfo.com/mcp",
      "headers": {
        "Authorization": "Bearer <YOUR_PANGOLINFO_API_KEY>"
      }
    }
  }
}
Once connected, a single full niche validation consumes 17 to 37 credits: 1 call to the Niche Filter API (10 credits/call), 2 pages of live SERP via the Scraper API (1 credit/page = 2 credits), 5 pages of head competitor PDPs via the Scraper API (1 credit/page = 5 credits), and 0 to 4 pages of the Reviews API (5 credits/page = 0–20 credits). Because Pangolinfo provides a free tier of 60 credits per month with no credit card required, operators can execute and score 1 to 3 complete niche audits every month at zero data cost.
Under our template’s recommended thresholds, the 100-point scale and the 5 Kill Switches converge into three strict score bands:
| Score Band (Our Template’s Recommended Thresholds) | Weighted Score Requirement | Kill Switch Condition | Operational & Capital Allocation Directive |
|---|---|---|---|
| GO | ≥ 75 / 100 | 0 Triggered | Proceed to supplier RFQ, physical sampling, and the 13-point pre-order checklist. |
| CAUTION | 50 – 74 / 100 | 0 – 1 Triggered (Triggering ≥ 2 triggers STOP regardless of score) | Freeze tooling capital; run sub-niche unbundling or price-band escape tests before reconsidering. |
| STOP | < 50 / 100 | OR ≥ 2 Triggered (Regardless of Score) | Immediate halt. Archive the niche as rejected and reallocate research credits. |
Notice the overriding rule at the bottom of the table: triggering 2 or more Kill Switches halts the project regardless of the 100-point score. Even if a niche scores 14/20 on demand and 8/15 on VOC differentiation, tripping two survival switches forces an automatic halt.
In addition to the three score bands above, un-scored rapid audits use CONDITIONAL GO as a case-specific diagnostic label—not a numeric /100 score band. In our empirical screening, the pass case (rizz em with the tism shirt) earned CONDITIONAL GO because it triggered 0 Kill Switches and had 4 of 5 dimensions clean with 1 dimension flagged amber (Top-5 brand click share at 44.3% vs. the 40% strict line).
2. Deriving the Five Kill Switch Thresholds
Setting arbitrary cutoffs destroys scorecard credibility. In our template’s recommended thresholds, the five Kill Switches (KS-01 through KS-05) were derived by contrasting Pangolinfo’s published ideal benchmarks against empirical stress tests across ~35 live US niches pulled from the 2026-08-02 Niche API snapshot and 2026-11-06 live SERP/PDP scrapes.
When we initially applied Pangolinfo’s strict ideal benchmarks—requiring Top-5 brand click share (top5BrandsClickShare) to stay strictly below 40%, searchVolumeT90 above 10,000, price between $20 and $70, successfulLaunchesT360 at ≥3, and returnRateT360 below 6%—not a single niche among the ~35 screened candidates achieved a clean pass. Every pet feeding niche we audited, including slow feeders and snuffle mats, failed outright with average reviews exceeding 1,100 and sponsored density above 92%. Even the least concentrated niche in the entire 35-niche cohort (rizz em with the tism shirt) posted a Top-5 brand click share of 44.3%, missing the strict 40% benchmark by 4.3 percentage points.
Furthermore, live API testing exposed a critical engineering caveat that every automated workflow must account for: Niche API filter parameters are unreliable for automated pre-screening. Specifically, during our live calls, extraFilters did not take effect, and sortField/sortOrder alongside top5ProductsClickShareT360Max were suspected unenforced by the upstream endpoint. If an AI agent blindly trusts query filter parameters to return pre-vetted niches, it will ingest polluted records. Therefore, you must never rely on API request filters for precise threshold gating; always pull the raw niche records and program your scorecard to judge each niche strictly by the returned records’ actual field values.
To prevent the 40% strict ideal from rejecting 100% of real-world opportunities while still blocking genuine monopolies, our methodology separates Strict Ideal Benchmarks, Amber Warning Zones, and Hard Kill Switch Cutoffs (our template’s recommended thresholds):
| Kill Switch ID & Name | Target Metric Source | Strict Ideal Benchmark | Amber Zone (Caution / Conditional) | Hard Kill Switch Cutoff (Our Template’s Recommended Thresholds) | Structural Failure Mode Prevented |
|---|---|---|---|---|---|
| KS-01: Brand Click Monopoly | Niche API (top5BrandsClickShare) |
< 40% | 44% – 50% (Requires low-risk supply chain) | > 65% | Shoppers click only entrenched brand names; new entrants starve for organic CTR. |
| KS-02: Launch Survival Freeze | Niche API (successfulLaunchesT90) |
successfulLaunchesT360 ≥ 3 |
1 in T90 (Observed in the pass case; narrow entry window) | = 0 in T90 | Zero new ASINs gained traction over the last 90 days; catalog algorithm has locked the page. |
| KS-03: Review Wall Lockout | Niche API (avgReviews) + Live SERP Top-5 Organic |
— (No strict ideal supplied; hard kill is avg >1,500 AND top-5 organic all >500) | — (Review wall judged by the hard kill rule and the live SERP top-5 sequence) | Avg > 1,500 AND Top-5 Organic All > 500 | Social proof barrier requires months of Vine/aggressive giveaway burn before converting at baseline CVR. |
| KS-04: Low-Price Ad Squeeze | Niche API (sponsoredShare, avgPrice) + Live SERP Median |
Price $20–$70 | Price $12–$19.99 (Between the verified $12 kill floor and the verified $20 strict floor) | Sponsored > 85% AND Avg/Median Price < $12 | Pay-to-play CPC bidding inside a sub-$12 retail ceiling guarantees negative unit contribution after FBA fees. |
| KS-05: Excessive Return Rate | Niche API (returnRateT360) |
< 6% | 6% – 8% | > 8% | High return processing fees, unsellable inventory write-offs, and voice-of-customer suppression badges. |
This three-tier calibration explains how our scorecard handles real data:
- On KS-01, 40% remains the strict benchmark line, 44%–50% functions as the amber zone (where
rizz em with the tism shirtsits at 44.3%, the lowest of all ~35 screened niches), and >65% fires the hard Kill Switch (wherelick mat for dogssits at 76.4%). - On KS-04, high ad density alone does not trigger a kill if retail prices provide enough gross margin buffer to absorb customer acquisition costs. The hard switch fires only when sponsored share exceeds 85% AND average or organic median price falls below $12—a lethal combination where CPC clicks devour the entire gross margin.
3. The 100-Point Scorecard Methodology
When a niche is evaluated across the full 100-point rubric (detailed alongside the data collection columns in A1’s Amazon Niche Discovery Workflow Template), points are distributed across five orthogonal dimensions. Under our template’s recommended thresholds, the weights intentionally skew toward competitive survival (50 points combined across Traffic Concentration and Review Wall/Launch Survival) rather than raw search volume (20 points).
Dimension 1: Demand & Growth (20 Points Max — Our Template’s Recommended Thresholds)
This dimension evaluates whether search demand is large enough to support a new entrant and whether trajectory is expanding or contracting.
- Primary Inputs:
searchVolumeT90,searchVolumeT90growth rate,searchVolumeT360,searchVolumeT360growth rate, and baseline category stability (returnRateT360contribution to baseline viability). - Scoring Logic: Niches clearing our published benchmark of
searchVolumeT90 > 10,000with positive 90-day and 360-day growth earn 15 to 20 points. WhensearchVolumeT360shows massive year-over-year expansion (such as +145.9%) but recentsearchVolumeT90growth decelerates to low single digits (+2.8%), the rubric awards strong base points (14/20) while deducting 6 points for near-term momentum flattening. If T90 growth turns negative (such as -15.4% in fading seasonal or meme cycles), points are docked proportionally to reflect trend decay risk.
Dimension 2: Traffic Concentration (25 Points Max — Our Template’s Recommended Thresholds)
Search volume is worthless if three or four legacy brands capture every click. Carrying a 25% weight, this dimension measures click distribution across products, brands, and sellers.
- Primary Inputs:
top5ProductsClickShare,top5BrandsClickShare, totalbrandCount, and totalsellerCountvs.productCount. - Scoring Logic: To earn 20–25 points, both Top-5 products and Top-5 brands must sit below the strict 40% threshold, accompanied by a diverse ratio of brands to products. When Top-5 brands fall into the 44%–50% amber zone, points compress into the moderate caution range. Once Top-5 products exceed 50% and Top-5 brands breach the >65% KS-01 line (such as 58.3% product share and 76.4% brand share), the score collapses to 0–5 points (4/25 in our kill case).
Dimension 3: Review Wall & Launch Survival (25 Points Max — Our Template’s Recommended Thresholds)
Tied as the heaviest weight at 25 points, this dimension bridges historical niche launch data with live front-page organic review barriers pulled via the Scraper API.
- Primary Inputs: Niche
avgReviews,avgRating,newProductsT360,successfulLaunchesT90, and the live SERP organic top-10 review sequence (specifically inspecting the organic top 5). - Scoring Logic: A healthy niche shows
successfulLaunchesT360 ≥ 3(our published benchmark); the pass case also had 1 successful launch in T90 and an average of 23.7 reviews, with a live SERP top-10 median of ~4. Conversely, whensuccessfulLaunchesT90 = 0(KS-02), niche average reviews exceed 1,500 (KS-03), and every single listing in the live SERP organic top 5 holds over 1,300 reviews, a new ASIN has virtually zero probability of reaching page-one organic visibility without catastrophic cash burn. Such lockouts score 3/25 in our kill case.
Dimension 4: Customer Acquisition Cost / Ad Crowding (15 Points Max — Our Template’s Recommended Thresholds)
This dimension models the cost of buying page-one traffic relative to the retail price ceiling.
- Primary Inputs: Niche
sponsoredShare, live SERP sponsored vs. organic row ratio, top-of-page ad dominance (first 4 slots), nicheavgPrice, and live SERP organicmedianPrice. - Scoring Logic: Because Pangolinfo’s Scraper API delivers 90%+ sponsored-placement detection, we cross-verify the Niche API’s
sponsoredShareagainst live page-one ad slots. However, analysts must watch for parsing edge cases: in certain apparel and Merch-on-Demand SERPs (as seen in our pass case below), all 60 live rows can flagsponsored=truedue to layout tagging anomalies, contradicting the Niche API’s verified 70.7% figure. When evaluating this dimension, always cross-reference both sources and rely on the verified niche record (70.7%) when a SERP tagging anomaly occurs. If verified sponsored share exceeds 85% (e.g., 95%) while all top 4 live SERP slots are paid ads and retail pricing sits below $12 ($8.87 avg / $9.99 median), acquisition economics fail KS-04 and score 2/15 in our kill case.
Dimension 5: VOC & Margin Viability (15 Points Max — Our Template’s Recommended Thresholds)
The final 15 points evaluate whether customer complaints offer a clear product improvement hook and whether the retail price band can fund that upgrade profitably.
- Primary Inputs: Live PDP 1–3 star critical review share,
aiReviewsSummarytopic mention and negative rates (or Reviews API pagination),returnRateT360, and unit price margin headroom. - Scoring Logic: High score requires both actionable complaint clusters such as the kill case’s Durability 77.2% negative and Grip 57.2% negative and a retail price band ($20–$70 ideal) capable of absorbing tooling/BOM upgrades. If a product has severe, fixable defects (e.g., 77.2% durability complaints) and low returns (1.52%), it earns partial credit (8/15) for defect clarity, but loses the remaining 7 points if sub-$10 pricing makes the upgraded BOM unprofitable. Conversely, if a product has almost zero negative complaints (“nothing to fix”), it cannot earn physical differentiation points here and must rely entirely on graphic/style novelty.
4. Kill Case Scoring: Lick Mat for Dogs
To see how the 100-point rubric and the 5 Kill Switches prevent a costly inventory mistake, we examine our primary kill case: lick mat for dogs (with live SERP and PDP verification run on dog lick mat). The raw data pull was executed inside WorkBuddy using the five-step protocol detailed in Part 2 (A2), the Step-by-Step Amazon Niche Research Workflow with AI.
Verified Data Inputs (lick mat for dogs / dog lick mat)
- Macro Niche Pull (
2026-08-02Snapshot):searchVolumeT90= 463,314 (+2.8%);searchVolumeT360= 1,742,644 (+145.9%); price range $4.40–$21.20, average price $8.87; 20 tracked products across 13 brands and 37 sellers; 95% sponsored share; Top-5 products click share 58.3%, Top-5 brands click share 76.4%; average BSR 33.87; average reviews 2,227.1; average rating 4.455; T360 new launches = 6, T90 successful launches = 0;returnRateT360= 1.52%. - Live SERP Verification (
2026-11-06Live Pull on"dog lick mat"): 60 rows returned (48 organic + 12 sponsored); the top 4 positions are all sponsored; #1 organic rank is LUKITO (B09FPTDBRZ) at $8.99, 4.4 stars, 8,783 reviews, 6K+/mo sales velocity badge, carrying the Overall Pick badge; organic price range is $3.99–$28.49 with an organic median price of $9.99; sequential review counts for the organic top 10 are 8,783 / 2,792 / 2,792 / 1,302 / 2,792 / 236 / new / 784 / 31 / 1,105. - Head PDP & VOC Audit (
2026-11-06Live Pull onB09FPTDBRZ): Note that our original historical sample ASINB0B178VDQQis dead ([ASIN_UNAVAILABLE]), requiring an immediate switch to live #1 organic leaderB09FPTDBRZ. Furthermore, because theget_amazon_reviewsendpoint returned 0 reviews 4 consecutive times on2026-11-06, all VOC metrics were extracted directly from the live PDP’s embeddedaiReviewsSummaryobject. OnB09FPTDBRZ(8,783 ratings, 4.4 stars, 1–3 stars ~16% ≈ 1,400 critical reviews, BSR #1,328 in Pet Supplies / #24 in Dog Feeding & Watering), Amazon’saiReviewsSummaryreported the following attribute mentions (Total / Positive / Negative — Negative %):- Durability:
193 / 44 / 149(77.2% negative) — verbatim buyer quote: “tore during first use, shredded into pieces within minutes” - Grip:
269 / 115 / 154(57.2% negative) - Ease of cleaning:
299 / 166 / 133(44.5% negative) - Suction:
257 / 154 / 103(40.1% negative) - Functionality:
201 / 174 / 27(13.4% negative) - Quality:
600 / 530 / 70(11.7% negative) - Engagement:
362 / 353 / 9(2.5% negative) - Pet preference:
446 / 437 / 9(2.0% negative)
- Durability:
Line-by-Line Scorecard & Kill Switch Calculation (Kill Case)
| Evaluation Layer | Dimension / Kill Switch Rule (Our Template’s Recommended Thresholds) | Max Weight / Cutoff | Measured Case Value (lick mat for dogs) |
Awarded Score / Status | Diagnostic Rationale |
|---|---|---|---|---|---|
| Dimension 1 | Demand & Growth | 20 pts | T360: 1,742,644 (+145.9%) T90: 463,314 (+2.8%) |
14 / 20 | Massive search base and low returns (1.52%), minus 6 pts for T90 growth slowing to +2.8%. |
| Dimension 2 | Traffic Concentration | 25 pts | Top-5 Products: 58.3% Top-5 Brands: 76.4% |
4 / 25 | Severe monopoly across 13 brands and 37 sellers; top 5 brands capture over three-quarters of clicks. |
| Dimension 3 | Review Wall & Launch Survival | 25 pts | Avg Reviews: 2,227.1 T90 Launches: 0 (T360: 6) |
3 / 25 | Organic top 5 hold 8,783 / 2,792 / 2,792 / 1,302 / 2,792 reviews; zero successful T90 entries. |
| Dimension 4 | Acquisition Cost | 15 pts | Sponsored: 95% (Top 4 SERP ads) Avg/Median Price: $8.87 / $9.99 |
2 / 15 | Near-total ad saturation colliding with a sub-$10 retail ceiling destroys paid traffic ROI. |
| Dimension 5 | VOC & Profit Viability | 15 pts | Durability 77.2% neg, Grip 57.2% neg, Cleaning 44.5%, Suction 40.1% | 8 / 15 | High actionable defect clarity (~1,400 critical reviews), but $8.87/$9.99 pricing cannot fund heavier chew-proof TPE molding. |
| Score Total | 100-Point Weighted Sum | 100 pts | 14 + 4 + 3 + 2 + 8 |
31 / 100 | Falls into the STOP (<50) band; final verdict CAUTION leaning STOP. |
| Kill Switch 1 | KS-01: Top-5 Brands > 65% | > 65% | 76.4% | TRIGGERED | Exceeds hard monopoly cutoff by 11.4 percentage points. |
| Kill Switch 2 | KS-02: T90 Launches = 0 | = 0 | 0 | TRIGGERED | Complete 90-day freeze on successful new product entries. |
| Kill Switch 3 | KS-03: Avg Reviews > 1,500 & Top-5 Organic > 500 | > 1,500 / > 500 | 2,227.1 avg (Top-5 all ≥1,302) | TRIGGERED | Incumbent review moat locks out page-one organic progression. |
| Kill Switch 4 | KS-04: Sponsored > 85% + Price < $12 | > 85% & < $12 | 95% & $8.87 avg / $9.99 med | TRIGGERED | Sub-$12 unit economics cannot survive 95% sponsored competition. |
| Kill Switch 5 | KS-05: Return Rate T360 > 8% | > 8% | 1.52% | NOT TRIGGERED | Product rarely triggers formal Amazon returns despite chewing complaints. |
Kill Case Verdict Synthesis: If a researcher looked only at Dimension 1 (14/20), KS-05 (1.52% returns), and the 77.2% Durability complaint rate, they might be tempted to mold a thicker silicone mat. The scorecard prevents that error. The niche totals 31/100 (inside the <50 STOP band) and triggers 4 Kill Switches (KS-01, KS-02, KS-03, KS-04), resulting in a definitive verdict of CAUTION leaning STOP — do not launch. Moreover, neighboring pet feeding niches offer no refuge: our broader screening confirmed that pet feeding subcategories are fully saturated, with both slow feeder and snuffle mat niches failing due to average reviews exceeding 1,100 and sponsored shares above 92%.
5. Pass Case Scoring: Rizz Em with the Tism Shirt
When every pet feeding keyword failed our screen, we broadened the audit across ~35 diverse US niches in the 2026-08-02 Niche API dataset to locate a passing benchmark. The empirical finding is sobering: no strictly passing niche (0 triggered Kill Switches AND all metrics inside strict ideal lines like <40% brand concentration) existed among the ~35 screened niches.
The single closest candidate across the entire cohort was rizz em with the tism shirt, a meme novelty T-shirt niche in the US marketplace. Because this is an Amazon Merch print-on-demand apparel niche (where the seller of record is Amazon.com) rather than a standard factory-sourced FBA hard good, its supply-chain logic differs fundamentally from our silicone pet mat kill case. Furthermore, no verified per-dimension /100 point breakdown or /100 total score was supplied or claimed for this pass case. In rigorous research reporting, we never fabricate synthetic dimension scores where none were measured; instead, we evaluate the pass case directly across the five weighted dimensions’ verified evidence and the five Kill Switch cutoffs.
Verified Data Inputs (rizz em with the tism shirt)
- Macro Niche Pull (
2026-08-02Snapshot):searchVolumeT90= 10,509 (-15.4% growth);searchVolumeT360= 61,693 (+70.7% growth); 41 products across 33 brands and 12 sellers; price range $5.00–$27.72, average price $16.32; sponsored share 70.7%; Top-5 brands click share 44.3% (the lowest concentration found among all ~35 screened niches, sitting 4.3 percentage points above the 40% strict line inside the 44%–50% amber zone); average reviews 23.7; average BSR 85,695; successful launches: T90 = 1 (T180 = 2, T360 = 7);returnRateT360= 0.8%. - Live SERP Verification (
2026-11-06Live Pull): 60 rows returned with retail prices spanning $13.99–$23.99. The sequential review counts across the top 10 listings are none / 2 / 1 / 2 / 191 / 7 / 1 / 22 / 5 / 9 (yielding a median of ~4 reviews). The head listing isB0CQZ9P86Qpriced at $21.99, rated 4.6 stars with 191 reviews, moving 100+/mo with the Overall Pick badge.- Critical SERP Anomaly Note: On the live
2026-11-06scrape, all 60 SERP rows returnedsponsored=true, which directly contradicts the Niche API record’s verified 70.7% sponsored share. This is a suspected Merch/apparel HTML parsing issue on Amazon’s search grid. In accordance with our data hygiene rules, we always cite the verified 70.7% niche figure and never claim that “the homepage is all ads.”
- Critical SERP Anomaly Note: On the live
- Head PDP & VOC Audit (
2026-11-06Live Pull onB0CQZ9P86Q): Across 191 total reviews, the 1–3 star critical share is ~10% (≈19 critical reviews). The live PDPaiReviewsSummarybreaks down as follows (Mentions / Negative Mentions):- Appearance:
14 mentions / 0 negative - Humor:
7 mentions / 0 negative - Comfort:
5 mentions / 0 negative - Durability:
6 mentions / 2 negative
- Appearance:
Five-Dimension Evidence & Kill Switch Audit (Conditional Pass Case)
(Note: No /100 dimension scores or /100 total are claimed for rizz em with the tism shirt; evaluation is governed by dimension-level evidence audit and Kill Switch clearance under our template’s recommended thresholds).
| Evaluation Layer | Weight / Rule (Our Template’s Recommended Thresholds) | Verified Case Evidence (rizz em with the tism shirt) |
Dimension / Switch Status | Analytical Comparison vs. Kill Case |
|---|---|---|---|---|
| Dimension 1: Demand & Growth | 20% Weight | T90: 10,509 (-15.4%) T360: 61,693 (+70.7%) |
CLEAN (With Trend Caution) | Clears the >10,000 T90 volume floor with strong T360 growth (+70.7%), though -15.4% T90 pullback signals meme lifecycle cooling. |
| Dimension 2: Traffic Concentration | 25% Weight | Top-5 Brands: 44.3% (41 products / 33 brands / 12 sellers) |
AMBER ZONE (44%–50%) | Misses the strict <40% ideal by 4.3 pts, but sits 32.1 pts healthier than the kill case’s 76.4% monopoly. Lowest of ~35 niches screened. |
| Dimension 3: Review Wall & Launch Survival | 25% Weight | Avg Reviews: 23.7 (SERP Top-10 median ~4) Launches: T90 = 1 / T180 = 2 / T360 = 7 |
CLEAN | Wide-open page-one entry: top-10 review sequence (none/2/1/2/191/7/1/22/5/9) has only one listing over 22 reviews. |
| Dimension 4: Acquisition Cost | 15% Weight | Verified Sponsored: 70.7% Avg Price: $16.32 (SERP $13.99–$23.99, Head $21.99) |
CLEAN | Avoids the sub-$12 trap; head listing converts at $21.99 with moderate 70.7% ad density (ignoring the 60/60 SERP parser anomaly). |
| Dimension 5: VOC & Profit | 15% Weight | 191 reviews (~10% critical ≈ 19): Appearance 14/0 neg, Humor 7/0, Comfort 5/0, Durability 6/2 neg | CLEAN (“Nothing to Fix”) | Zero structural defect clusters (vs. 154 Grip & 149 Durability negatives in kill case); return rate is just 0.8%. |
| KS-01: Brand Monopoly | Cutoff > 65% | 44.3% | NOT TRIGGERED | Sits in the 44–50% amber zone; well below the 65% hard kill line. |
| KS-02: Launch Freeze | Cutoff T90 = 0 | 1 (with T180 = 2, T360 = 7) | NOT TRIGGERED | Active new-launch survival across 90, 180, and 360-day windows. |
| KS-03: Review Wall | Cutoff Avg > 1,500 | 23.7 avg (Top-10 median ~4) | NOT TRIGGERED | Virtually zero review barrier on page one. |
| KS-04: Low-Price Ad Squeeze | Cutoff > 85% & < $12 | 70.7% & $16.32 avg ($21.99 head) | NOT TRIGGERED | Both sponsored share and average/SERP price clear the cutoff safely. |
| KS-05: Return Rate | Cutoff > 8% | 0.8% | NOT TRIGGERED | Ultra-low return rate (even lower than the kill case’s 1.52%). |
| Overall Case Verdict | Dual-Gate Rubric | 0 Kill Switches Triggered; 4 of 5 Dimensions Clean; 1 Amber | CONDITIONAL GO | Viable only for fast-turn/POD models capable of riding meme velocity without deep inventory lockup. |
Three Methodological Lessons from the Pass Case
- Why BSR 85,695 Cannot Be Compared to BSR 33.87: Novice analysts looking at the two Niche API snapshots often ask why the kill case has an average BSR of 33.87 while the pass case has an average BSR of 85,695. Never compare BSR across categories. The kill case’s 33.87 reflects ranking inside a compact pet-feeding subcategory node, whereas 85,695 reflects ranking inside Amazon’s massive root Clothing, Shoes & Jewelry catalog (hundreds of millions of parent/child SKUs). The numerical gap reflects category catalog size, not buyer demand—
B0CQZ9P86Qstill generates 100+/mo unit sales at $21.99. - The “Nothing to Fix” VOC Paradox: In
lick mat for dogs, we found massive complaint clusters (154 negative mentions on Grip, 149 negative mentions on Durability), proving that functional hard-goods niches fail on unit economics and review walls, not lack of product flaws. Inrizz em with the tism shirt,B0CQZ9P86Qshows Appearance 14/0 negative, Humor 7/0 negative, Comfort 5/0 negative, and Durability 6 mentions with only 2 negative. There is “nothing to fix.” When a niche passes on low review barriers (23.7 avg, SERP median ~4) and clean launch survival (T90 = 1, T360 = 7), differentiation shifts from physical tooling engineering to graphic design iteration and trend speed. - Why Amber 44.3% Earns a CONDITIONAL GO: Because Top-5 brand click share (44.3%) breaches the strict 40% ideal line, a traditional FBA seller ordering custom-manufactured units overseas should hesitate, especially given the -15.4% T90 search volume dip. However, because all 5 hard Kill Switches are clean (0 triggered) and 4 of 5 dimensions pass, print-on-demand or rapid-turn apparel sellers can execute under a CONDITIONAL GO.
6. Six-Framework Threshold Comparison and the 13-Point Pre-Order Checklist
To contextualize how our template’s recommended thresholds sit relative to mainstream Amazon product research schools, our underlying research report benchmarked six distinct industry frameworks across five core parameters: target price band, BSR ceiling, review cap, brand/click concentration, and net margin floor.
While we never fabricate or attribute unverified numerical cutoffs to external commercial tools, comparing the directional philosophy of the five external frameworks against Pangolinfo’s published benchmarks (our template’s recommended thresholds) reveals why legacy playbooks struggle in 2026:
| Evaluation Parameter | Pangolinfo Published Benchmarks (Our Template’s Recommended Thresholds) | Legacy High-Volume / “Jungle-Era” Frameworks (Directional) | Conservative Bootstrapped / Micro-Brand Frameworks (Directional) | Aggregator / Private-Equity Acquisition Frameworks (Directional) | Rapid Trend / POD & Merch Frameworks (Directional) | Factory-Direct / Supply-Chain Cost-Leader Frameworks (Directional) |
|---|---|---|---|---|---|---|
| Target Price Band | $20 – $70 (Hard KS-04 floor at <$12 with >85% ads) | Looser lower bound (often tolerated lower-priced impulse items before FBA fees rose) | Stricter higher bound (typically demands higher ticket sizes to buffer small batch MOQs) | Stricter mid-to-high ticket focus to protect absolute dollar contribution per unit | Looser lower bound ($13.99–$23.99 acceptable due to zero inventory holding risk) | Looser lower bound (relies on factory cost advantage to survive low-price wars) |
| Demand / BSR Floor | searchVolumeT90 > 10,000 (Strict rule: never compare BSR across categories) |
Relied heavily on flat root-category BSR caps regardless of node depth | Accepts lower search volume ceilings in exchange for low review competition | Demands deep, stable multi-year search volume; rejects declining T90 trends | Prioritizes T360/recent velocity spikes over multi-year historical baselines | Targets high-volume commodity keywords regardless of BSR concentration |
| Review Cap & Launch Velocity | successfulLaunchesT360 ≥ 3 (Hard KS-02 at T90 = 0; KS-03 at avg > 1,500 & top-5 > 500) |
Focused on static top-10 review averages without tracking 90-day new-launch survival | Stricter low-review caps on page one; halts if top organic slots carry heavy review walls | Tolerates higher review walls if paid acquisition budget can force rank | Requires ultra-low SERP median reviews (like the ~4 median in our pass case) | Often ignores review walls, assuming rock-bottom pricing will force conversion |
| Click Concentration | top5BrandsClickShare < 40% strict (44%–50% amber; KS-01 hard kill at > 65%) |
Measured revenue spread via third-party estimates rather than first-party click share | Strictly avoids niches where top brands capture high click shares | Evaluates brand share alongside off-Amazon brand moat and trademark density | Accepts 44%–50% amber brand share if top listings are fragmented graphic variations | Frequently overlooks brand click share, leading to inventory traps like our kill case |
| Quality & Margin Guardrails | returnRateT360 < 6% (Hard KS-05 at > 8%; full FBA fee-stack stress test) |
Ignored category return rates and modeled naive FBA referral + base fulfillment only | Enforces strict net margin minimums after accounting for initial launch PPC burn | Models full landed contribution margin including storage, returns, and ACoS | Zero tooling or return write-off exposure under Amazon Merch fulfillment terms | Operates on thin net percentages, highly vulnerable to placement and return fee creep |
How the Six-Framework Comparison Shaped Our Thresholds
Contrasting these six approaches directly shaped the dual-gate design in Section 2:
- Replacing Naive BSR Caps with
searchVolumeT90 > 10,000andsuccessfulLaunchesT90: Legacy frameworks that set universal BSR cutoffs fail because a BSR of 33.87 in a pet feeding sub-node and 85,695 in apparel represent completely different catalog denominators. TrackingsearchVolumeT90 > 10,000alongsidesuccessfulLaunchesT360 ≥ 3(and hard-killingT90 = 0) measures actual buyer traffic and new-entrant survival directly. - Bridging the 40% Strict Benchmark and the 65% Kill Switch: Conservative frameworks that walk away the moment Top-5 brand share crosses 40% would reject all ~35 niches in our 2026 sample. By establishing <40% as the clean target, 44%–50% as the conditional amber zone, and >65% as hard Kill Switch KS-01, the scorecard separates insurmountable monopolies (76.4%) from playable niches (44.3%).
Governance Rules for the 13-Point Pre-Order Checklist
Once a niche survives the 5 Kill Switches and clears the 100-point scorecard (earning a GO or a case-specific CONDITIONAL GO), it must pass the final operational gate before you wire a factory deposit: the 13-Point Pre-Order Checklist published in Part 1 (A1), the Amazon Niche Discovery Workflow Template.
We do not reprint the 13-point table here, but every product committee must enforce its three tier-based governance rules (under our template’s recommended thresholds):
- Rule 1 — Beginners Must Pass at Least 11 of 13 Points (
≥ 11/13): First-time and capital-constrained sellers lack the cash reserves or supply-chain leverage to absorb multiple operational defects. If a niche fails more than 2 items on the 13-point checklist, beginners must walk away. - Rule 2 — Mature Sellers May Relax 2 to 3 Points: Experienced operators with established freight forwarders, low-cost factory credit terms, or existing brand audiences may selectively relax 2 to 3 non-fatal checkpoints (such as entering the 44%–50% brand concentration amber zone or accepting a tighter initial ACoS window).
- Rule 3 — Failing 5 or More Points Equals Gambling (
≥ 5 Failures = Halt): Regardless of seller experience or factory backing, failing 5 or more points out of 13 reduces the launch to pure speculation. Any project failing 5+ checkpoints is automatically vetoed.
7. Real FBA Fee Stack and FAQ
Even when a niche passes competitive screening, unit economics frequently collapse between the initial spreadsheet estimate and the first FBA settlement report. In Dimension 5 (VOC & Profit Viability) and Checkpoint verification, sellers must replace “naive margin math” with a full 2026 FBA fee-stack audit.
The NovaData Case: Why Naive $11.00 Net Collapses to $4.20 Real Net
To illustrate how hidden platform charges erode contribution margin, consider the NovaData case cited in the research report (note: this figure is an external case from the research report, not our direct measurement from the lick mat for dogs or rizz em with the tism shirt API pulls).
In the NovaData case cited in the research report, a seller modeled a prospective product using a standard “naive” FBA calculator—deducting only basic manufacturing COGS, standard referral fees, and baseline FBA pick-and-pack fulfillment. That naive calculation projected a healthy $11.00 net profit per unit. However, once the product launched into live trading and absorbed 6 hidden FBA operational fees plus a 32% ACoS (Advertising Cost of Sales), the seller’s real net profit collapsed from $11.00 down to $4.20 per unit—wiping out a massive share of projected unit profitability.
When you connect the lesson of the NovaData case cited in the research report ($11.00 naive net shrinking to $4.20 real net after 6 hidden FBA fees + 32% ACoS) back to our kill case (lick mat for dogs), the necessity of KS-04 (Sponsored > 85% AND Avg/Median Price < $12) becomes unmistakable. If a mid-ticket product loses $6.80 per unit to hidden FBA fee stacking and a 32% ACoS, a dog lick mat retailing at an $8.87 niche average or $9.99 SERP organic median inside a 95% sponsored environment has zero mathematical path to positive net cash flow—especially if you increase product weight and molding costs to fix its 77.2% Durability complaint rate.
FAQ
Why does the 2026 scorecard combine 100-point weighted scoring with 5 hard Kill Switches instead of using just one method?
A weighted 100-point score and hard Kill Switches solve two different failure modes. Pure weighted scoring suffers from compensatory masking, where massive search volume—such as 1,742,644 annual searches in lick mat for dogs—adds enough points to disguise a fatal flaw like 0 successful new launches in 90 days. Conversely, pure binary filters reject every candidate when markets tighten. Pairing both under our template’s recommended thresholds lets the 100-point rubric measure continuous capital attractiveness while the 5 Kill Switches enforce non-negotiable survival boundaries, automatically halting any project that triggers 2 or more switches regardless of its point total.
How were our template’s recommended thresholds derived, and when can a seller safely adjust them?
Our template’s recommended thresholds were calibrated by benchmarking six industry frameworks against live 2026 catalog stress tests across roughly 35 US niches. When strict textbook ideals—like Top-5 brand click share under 40%—yielded zero clean passes across all 35 niches, we separated strict benchmarks (<40%) from conditional amber zones (44%–50%) and hard Kill Switch cutoffs (>65%). Sellers may adjust soft scoring weights to match their capital model, such as print-on-demand operators tolerating the 44.3% amber brand concentration in rizz em with the tism shirt, but should never relax hard Kill Switches like KS-02 or KS-04.
What does a “CONDITIONAL GO” with 4 of 5 clean dimensions and an amber brand concentration flag mean in practice?
A CONDITIONAL GO means the niche cleared all 5 hard Kill Switches and passed 4 of the 5 scorecard dimensions cleanly, but triggered a warning inside the amber zone on a single dimension. In our pass case rizz em with the tism shirt, demand, launch survival (1 in T90, 7 in T360), review barriers (23.7 average, SERP median ~4), and return rate (0.8%) are all clean, while Top-5 brand click share sits at 44.3%—4.3 points above the 40% strict line. You can launch only if your supply chain caps downside inventory exposure, such as rapid micro-batches or print-on-demand.
How should beginners versus experienced sellers apply the 13-point pre-order checklist before wiring a factory deposit?
The 13-point pre-order checklist in Part 1 (A1) acts as the final operational gate after a niche passes the scorecard. Under our template’s recommended thresholds, execution follows three strict rules based on operator maturity. First, beginners must pass at least 11 out of 13 checkpoints (11/13) before ordering inventory, because they lack the cash buffer to survive unexpected fee creep or launch delays. Second, mature sellers with established supply chains and ad efficiency may selectively relax 2 to 3 non-fatal points. Third, failing 5 or more checkpoints (5+) equals gambling and requires an immediate halt for any seller.
How does the real FBA fee stack impact Dimension 5 scoring, and what does the NovaData case demonstrate?
Dimension 5 (VOC & Profit, 15 points) evaluates whether a niche’s retail price ceiling can fund product upgrades and still leave a net profit after live Amazon friction. In the NovaData case cited in the research report, a product that projected an $11.00 naive net profit per unit on a basic calculator dropped to $4.20 real net profit once 6 hidden FBA operational fees and a 32% ACoS were deducted. That $6.80 per-unit erosion proves why our scorecard triggers KS-04 whenever sponsored share exceeds 85% and average or median retail price sits below $12.