
Outsource collection and what disappears is the parsers and the proxy pool. What does not disappear is data quality governance. Most people searching for an Amazon data pipeline API are not trying to learn how to send a request. They are trying to get out of spending two engineering days a week fixing scrapers. But the failures teams hit in their first year after migrating almost all live outside the collection layer: fields going null with no error, data going stale with no alert, retries inflating the bill by a multiple. This article gives you a six-layer reference architecture, what each layer owns, which maintenance you cannot hand off, and how to compress that irreducible part into an automated quality gate.
If you are planning or rebuilding an Amazon data pipeline, you have lived some version of this loop: write the parser, ship it, Amazon changes the page, the parser breaks, you get paged at 2am, you fix the parser. Run that loop enough times and somebody on the team asks the question out loud — can we stop maintaining scrapers?
Yes. But plenty of teams discover after migrating that their engineers did not get free time; they got a different thing to maintain. The difference matters. A broken parser is a loud failure: it throws, it returns nothing, the logs fill up, you know within minutes. Data quality degradation is a quiet failure. It does not page anyone. It just makes your dashboards less trustworthy week by week, and by the time somebody notices, nobody can say when it started.
That quiet failure is what this article is about. We will lay out the real cost structure of the four routes, give you the six-layer architecture, then take apart the retry logic people get wrong most often, the quality gate that should be automated, and the schema contract tests that get skipped. If you have not yet settled whether to use an API or scrape at all, read Amazon API vs Web Scraping: Choosing Your Data Route first — that one answers the prior question.
1. First, what are people avoiding?
Three kinds of teams search this term. Their goals differ, but the pain overlaps on almost every point.
Team one: the ones being dragged down by scraper maintenance
They already have a working collection system. The problem is that it eats one to two engineering days a week. Layout changes, CAPTCHAs, proxy bans, browser fingerprinting, memory leaks — none of these are fatal alone, but together they are a steady bleed. What they want when they type the query is a way to convert this from our engineering problem into somebody else’s service problem.
Team two: the ones building a data platform
They do not have an Amazon data source yet and are in the middle of technical selection. What they fear is not cost — it is sunk cost. Getting halfway into a scraper build and discovering you cannot maintain it means everything before that point is wasted. They need a path that has already been walked, not a product pitch.
Team three: the ones who got scared by the bill
They already consume a third-party data service and the monthly invoice does not match what they modelled. The cause is almost always unmeasured retry amplification: requests multiplied by average attempts, divided by the usable record rate, is your real unit price. These teams do not need a new vendor. They need a corrected cost model.
What all three share is this: they are not trying to get rid of collection, they are trying to get rid of maintenance. So when you evaluate any option, the question is not can it get the data — it is how many people do I still need watching this thing after we plug it in. That question drives every architecture decision that follows.
Before you read further, do one thing: add up the engineering hours your team spent on data collection maintenance over the last eight weeks and divide by eight. That weekly average is the denominator for every decision below, because it puts the monthly fee for an API on the same scale as the headroom cost of keeping the scrapers. Most teams are surprised the first time they run this number, and the reason is that the total is not just bug-fixing time. It includes chasing false alarms, answering questions from operations, updating dependencies, and the context-switching cost of each fire. Skip this step and your cost conversation will stay at the level of vibes.
2. Four routes that avoid scrapers, and what each invoice looks like
We will not name vendors or quote second-hand prices. We will talk about cost structure, because structure is stable and price numbers are not.
| Route | Dominant cost | Who owns maintenance | Typical failure mode | Best fit |
|---|---|---|---|---|
| Self-built scraper stack | Engineer debugging time, far exceeding servers | All of it, in-house | Layout change breaks parsing | Very long-tail pages, dedicated team |
| Managed platform or self-hosted framework | Compute time plus parser upkeep | Runtime outsourced, logic in-house | Harder anti-bot means a bigger bill | Existing expertise, need for custom logic |
| Official SP-API | Authorisation ops and per-operation rate planning | In-house, but low failure rate | Throttling and expired grants | Your own operational data |
| Vertical Amazon data API | Per-call billing plus self-built quality governance | Collection outsourced, judgement in-house | Fields going null, data going stale | Market and competitor data |
The two columns worth studying are maintenance ownership and typical failure mode. Wherever maintenance lives is where your engineers will be staring, and whatever the failure mode is, that is what your alerts need to be built around. Most teams compare only the cost column, then discover after go-live that they have no monitoring at all for the failure mode they just signed up for.
Route one: build your own scraper stack
A headless browser cluster plus a proxy pool plus parsers. The upside is maximum control — anything visible on the page is reachable in principle, there is no per-record billing, and marginal cost flattens as you scale. The downside is that the cost lands in the wrong bucket. You think you are spending money on servers; you are spending it on engineering time. In a live scraper stack, servers are the smaller line item on most teams and debugging is the larger one. The other point that teams underweight is that anti-bot evasion is a permanent arms race. The trick that works today is not guaranteed to work in six months.
Route two: managed scraping platforms or self-hosted open-source frameworks
Scrapy, Playwright clusters, hosted actor marketplaces. The upside is speed to first result and a mature ecosystem where much of the parsing logic has been written before. The downside is that maintenance did not transfer. The platform took over browsers and runtime; you still own parsing logic, selectors, retry policy, and anti-bot strategy. Worse, most managed platforms bill by compute duration, which means the harder the anti-bot, the higher your bill. Cost correlates with difficulty, and that is a miserable property for a budget model.
Route three: the official SP-API
The upside is stability and compliance, with an explicit schema and no anti-bot fight. The downside is that coverage is bounded by the authorisation model. It gives you orders, inventory, fulfilment, and your own advertising data for accounts a seller has authorised under a grant. It does not give you competitor prices, market-wide search rankings, or other sellers’ reviews. That is not a not-yet-supported gap; it is not offered by design. SP-API is therefore one component of a pipeline in most setups, never the whole thing.
Route four: a vertical Amazon data API
You hand parsing and anti-bot to a specialist and receive structured JSON. The upside is that maintenance transfers — a page redesign becomes the vendor’s problem, the proxy pool becomes the vendor’s problem, and your engineers stop watching selectors. The downside is that quality governance does not transfer, and field coverage varies by a wide margin between vendors in a way that never shows up on a feature grid. The evaluation method is in Best Amazon Data API: 4 Numbers That Expose Every Claim — run a blind test on one set of ASINs and measure field coverage, non-null fill rate, usable record rate, and cost per thousand usable records.
The realistic end state is a mix. Your own operational data through SP-API, market and competitor data through a data API, and a thin self-built layer for long-tail pages where you need one. Replacing pick one route with decide which data goes down which route makes the decision much clearer.
There is a simple test for drawing the boundary: if the question can be answered by asking did I get authorisation, use the official channel; if it is what is happening in the marketplace right now, use a data service. The first is an authorisation problem, the second a collection problem, and their failure modes, cost structures, and compliance obligations are different enough that forcing them onto one technical path raises complexity on both sides. What justifies keeping a scraper on most teams is a handful of long-tail pages no vendor covers — keep that to one or two object types and the maintenance stays tolerable.
3. After you migrate, you will find the maintenance moved rather than vanished
This section is the premise for everything that follows. If you do not accept it, the architecture below will look over-engineered.
From parse failure to missing field
When a scraper fails it is loud: an exception, an empty result, logs scrolling past, you know within minutes. When an API fails it is quiet: HTTP 200, valid JSON, schema validation passes, and twelve of the fields are null. The difference is that the failure signal in the first case lives at the transport layer, while in the second it exists only at the business-semantics layer — and nobody writes business-semantics validation for you.
From being blocked to going stale
Getting blocked by anti-bot gives you an unambiguous failure. The API-side equivalent is freshness decay: the vendor adjusts its cache policy, collection frequency drops in one marketplace, an upstream job backs up, and the value you receive is three days old. The format passes schema validation. It no longer describes reality. The only way to catch this is a freshness SLO plus monitoring the staleness distribution. There is no shortcut.
From proxy cost to retry-amplified cost
In the self-built era your costs were proxies and machines, most of it fixed. In the API era your cost is unit price multiplied by attempts, and attempts get amplified by failure rate, backoff policy, and idempotency implementation together. A pipeline with a 70% usable record rate and 1.8 average attempts is paying 2.57 times list price. Unmonitored, that multiplier drifts, and it drifts by increments too small to notice — nobody changed any code, and one day the invoice is 40% higher.
Put those three together and the conclusion is direct: collection can be outsourced; judgement cannot. Once the collection layer is gone, what you have to build yourself is a mechanism that decides whether the data is still usable. In the six-layer architecture below, that mechanism is layer five, the quality gate.
One migration story makes this concrete. A six-person data team replaced their in-house scraper with a third-party API and reclaimed around two engineering days a week. Everyone was happy. Then in month three, operations started saying the competitor prices in the report looked odd. Investigation showed that the fill rate for the price field in two marketplaces had fallen from 96% to 61% — over five weeks, with no alert, because every request returned 200 and the success-rate metric never dropped below 99%. Fixing it took two weeks, a week and a half of which was archaeology: with no raw response archive, nobody could establish which day it started.
The lesson is not that they should not have migrated. It is that quality monitoring has to be built in the same project as the migration. Had they shipped raw archiving and field-level fill-rate monitoring at the same time, the decay would have surfaced in week one and the fix would have been a parameter change rather than two weeks of forensics.
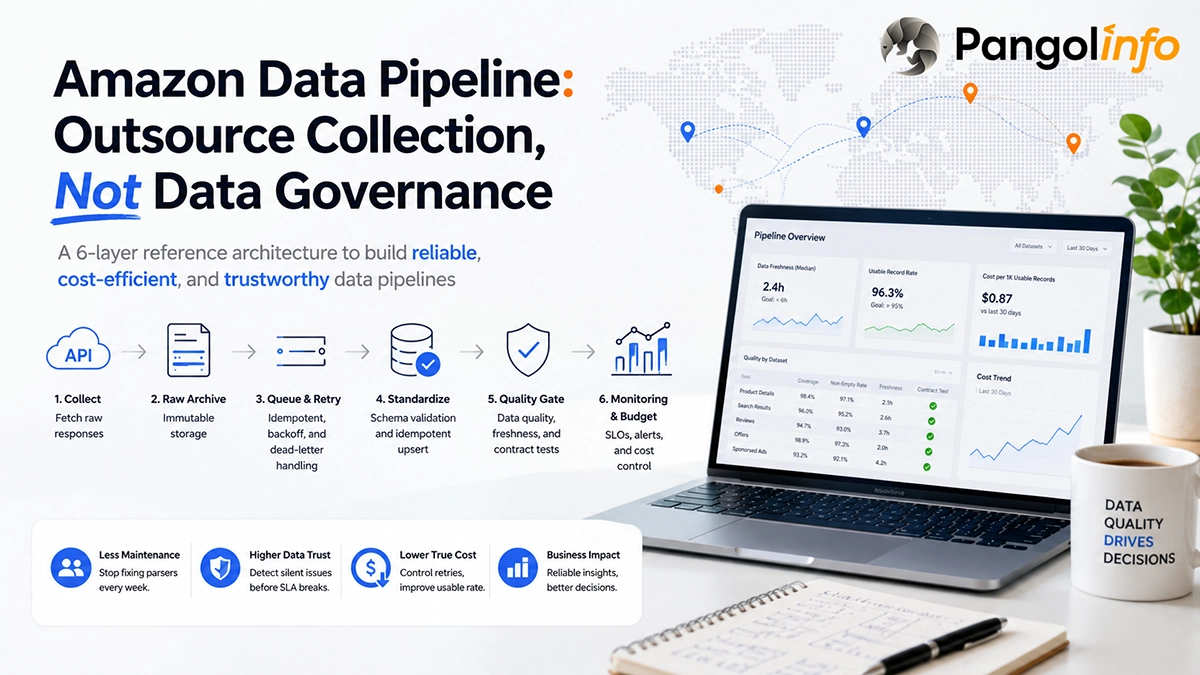
4. The reference architecture: six layers, one job each
This is not a theoretical model. It is the shape that teams running stable pipelines converge on. The rule is one responsibility per layer, so a failure can be localised.
Business goal
   │  field contract · freshness SLO · cost budget
   ▼
┌────────────────────────────────────────┐
│ L1 Collect     fetch raw, no judgement      │
├────────────────────────────────────────┤
│ L2 Raw archive  verbatim, the only replay   │
├────────────────────────────────────────┤
│ L3 Queue+retry  idempotency · backoff · DLQ │
├────────────────────────────────────────┤
│ L4 Normalise    contract check · upsert     │
├────────────────────────────────────────┤
│ L5 Quality gate four numbers decide release │
├────────────────────────────────────────┤
│ L6 Observe      panels · alerts · weekly    │
└────────────────────────────────────────┘
   │
   ▼
Downstream: reports / models / agents / alerts
Layer zero: the inputs are contracts, not requirements
Before any code, write three things down, each decidable by a machine: a field contract — the fields the business depends on, graded P0/P1/P2; a freshness SLO — the P95 staleness ceiling for P0 fields, say six hours; and a cost budget — the ceiling per thousand usable records. These three are the basis for every automated judgement downstream. Without them, the quality gate has to guess its thresholds, and a guessed threshold gets switched off after the first false alarm.
The most common mistake in writing a field contract is wanting everything. A contract listing 80 fields all marked P0 is equivalent to no contract: the usable record rate collapses toward zero, the gate screams on every batch, and somebody turns it off. P0 means a record missing this field cannot go into the downstream report — in practice no more than 15 fields. P1 means nice to have, tolerable if missing. P2 means useful some of the time, may be null. The grading is not bureaucracy; it determines retry policy, degradation tiers, and gate thresholds.
Layer one: the collector fetches, it does not judge
Draw this boundary hard. The collector sends the request, takes the response, and hands it onward. It does no field validation, no business judgement, no cleaning. The reason is attributability: if business logic lives inside the collector, you cannot tell whether bad data was fetched wrong or judged wrong. The collector should emit two things and nothing else — the raw response body, and metadata about the call: duration, status code, timestamp, attempt number.
Layer two: raw archive is the only basis for reproducibility
Write responses verbatim, partitioned by object, marketplace, and date, retained 30 to 90 days. The value shows up only when something breaks: if you suspect a record is wrong, can you go back to that exact response body from three months ago? If not, every root-cause analysis you do is guesswork. Compressed JSON is cheap.
There is a practical rule for choosing retention: it has to be longer than your detection cycle. If your team takes three weeks on average to notice a data anomaly, 30 days lets you look back once and 90 days lets you compare. Compressed raw JSON almost always costs less than recomputing aggregate metrics over the same window, so err on the generous side here.
Layer three: queue and retry
This layer owns scheduling, concurrency control, throttling, and retries. The key design is routing by error class: throttling and server errors go to retry; authorisation and parameter errors go straight to the dead-letter queue; a 200 with all P0 fields empty goes to a soft-fail queue. Mixing those three into one retry loop is the single biggest cause of runaway retry cost. Section five has the implementation.
Layer four: normalise and store
Map the raw response onto your internal schema, assert types with no coercion, then write with idempotency. The write must be idempotent: processing the same object for the same day twice must produce the same result. In practice the unique key is object identifier plus marketplace plus data date plus contract version, and the write is an upsert, not an insert. This layer should also record which P0 fields were missing, for the next layer to consume.
Layer five: the quality gate decides release
This is the layer you must build yourself and cannot buy. It computes four numbers per batch — field coverage, non-null fill rate, usable record rate, freshness compliance — and either releases the batch to downstream or marks it degraded. The point of the gate is not perfect data. It is that degradation becomes an alarm instead of a fact everybody accepts over time. Section six has a runnable implementation.
Layer six: monitoring and budget
Trend the four numbers, alert on them, attribute cost to business objects, and run a fixed-sample regression every week. Weekly regression is the item most often skipped and the most valuable: a one-off acceptance test proves it works now, a weekly regression proves it still works. Put the budget guard here too — when cumulative daily cost crosses the threshold, reduce sampling frequency without a human in the loop rather than waiting for the month-end invoice.
Only five charts deserve permanent space on the dashboard: usable record rate over time (one line per object type), P0 fill rate over time (one line per marketplace), P95 staleness over time, retry amplification factor over time, and cost per thousand usable records over time. Five is enough; more and nobody looks. The first three answer is the data still usable, the last two answer what is it costing. Making success rate the hero chart is a common mistake — it sits above 99% for the life of the pipeline, conveys nothing, and occupies the most prominent space on the page.
Two things that cut across every layer
Two concerns belong to no single layer but affect all of them, so they get their own section.
Model concurrency and rate limits per operation. Planning around one global QPS is a common error. Both official channels and most serious data services use per-operation token buckets: different operations carry different quotas and different refill rates. What you need is not how many requests per second do we send but a table of per-operation quotas, plus per-operation backoff implemented client-side. Without that table your concurrency plan is guesswork and your load test is meaningless, because throughput measured on one operation tells you nothing about another.
Lineage has to trace back to the specific call. Every landed record should carry source metadata: request ID, vendor response timestamp, attempt count, contract version, collection batch ID. It is a handful of fields, but without it you cannot answer the question of when this price was collected. Lineage is also what makes root-cause analysis tractable — when a field starts decaying, you slice by batch, marketplace, and time instead of re-running everything and hoping.
5. Retry and idempotency: where people get it wrong
Retry logic looks trivial and is in practice the part teams get wrong most often in an Amazon data pipeline. There are three classic mistakes: not classifying errors, backoff without jitter, and idempotency keys built on the wrong fields.
Three error classes, three treatments
Retryable: throttling responses, 5xx, network timeouts. Back off and retry, with a cap. Not retryable: authorisation failures, parameter errors, malformed requests. Retrying ten thousand times produces the same result and only multiplies cost — route these straight to dead letter and alert. Soft failures: HTTP 200 with critical fields empty. Do not count these as success and do not retry them forever; send them to a separate soft-fail queue and let the quality gate decide per batch whether this is noise or systemic.
Backoff needs jitter
Exponential backoff is standard, but exponential backoff without jitter produces retry storms: a batch fails together, waits together, retries together, and saturates the rate limit on the same millisecond. Multiplying the backoff by a random factor spreads the retries out. You also need a ceiling, or tail latency runs away.
for attempt in range(1, MAX_ATTEMPTS + 1):
    try:
        resp = fetch(item)
        raw_store.save(item.id, resp, meta=build_meta(attempt))
        return ok(resp)
    except Retryable as e:        # 429 / 5xx / timeout
        sleep(backoff(attempt))
    except NonRetryable as e:     # 401 / 422 / bad params
        dead_letter.push(item, reason=e.code)
        return fail(e)
    except EmptyButOk as e:       # 200 but every P0 field is empty
        soft_fail.push(item, reason="p0_empty")
        return fail(e)
dead_letter.push(item, reason="attempts_exhausted")

def backoff(attempt):
    # exponential backoff with jitter:
    # CAP stops runaway tail latency, random() breaks up retry storms
    return min(CAP_SECONDS, BASE_SECONDS * 2 ** (attempt - 1)) * (0.5 + random.random())
Timeouts matter more than retry counts
Teams spend their tuning effort on retry counts and set timeouts to whatever number came to hand, but timeouts move cost and throughput more. Too short and requests that would have succeeded get marked failed and retried, inflating cost and duplicating work — and in data services, some complex objects are slow by nature, so a blanket short timeout raises your failure rate on every slow object. Too long and failing requests hold concurrency slots, the queue backs up, and total throughput drops.
Derive the value from your own latency distribution per operation: take P99 as the baseline and add headroom. Calculate it from your call logs; do not inherit a default. Separate connect timeout from read timeout too — the former should be a few seconds, the latter should follow the response distribution.
Choosing an idempotency key
The key must include the contract version. Many teams use object ID plus marketplace plus date, which works until the contract changes. Add a new P0 field and historical records no longer satisfy the new contract, but without a version component they look already processed and get skipped. Include the version and a contract upgrade triggers a full re-run by itself, which is the correct behaviour.
A dead-letter queue is not a bin
Dead-letter contents have to be consumed, or the queue is just slow deletion. The minimum bar: aggregate by failure reason, produce a daily list, and alert on shifts in the reason distribution. The distribution reveals problems earlier than the failure rate does in most runs — a sudden rise in attempts_exhausted points to upstream success degrading while your headline success metric is still above threshold.
The collection chain also carries a few failure modes a compiler will not catch — network fingerprinting, the concurrency model, and idempotent re-runs. We break those down for Node.js in Amazon data API with Node.js: the failures your types cannot catch.
6. The quality gate: four numbers plus a freshness SLO
The gate’s job is to convert is this data usable from a judgement call into five quantities a machine can compute. The code below runs as written; feed it your raw records.
Coverage and fill rate are different numbers
Presence is not value. Coverage asks whether the path exists at the schema level; fill rate asks whether a value arrived. Both low means the field is not supported. High coverage with low fill rate means the field is on the contract but the vendor cannot populate it on most records — which is more dangerous, because schema validation lets it through.
def field_present(rec, path):
    cur = rec
    for part in path.split("."):
        if not isinstance(cur, dict) or part not in cur:
            return False
        cur = cur[part]
    return True

def field_filled(rec, path):
    if not field_present(rec, path):
        return False
    cur = rec
    for part in path.split("."):
        cur = cur[part]
    if cur is None: return False
    if isinstance(cur, str) and cur.strip() == "": return False
    if isinstance(cur, list) and len(cur) == 0: return False
    return True

def coverage(records, fields):
    total = len(records) * len(fields)
    return sum(1 for r in records for f in fields if field_present(r, f)) / total if total else 0.0

def fill_rate(records, fields):
    total = len(records) * len(fields)
    return sum(1 for r in records for f in fields if field_filled(r, f)) / total if total else 0.0
Usable record rate judges the whole record
The two metrics above are field-level, but downstream consumes records. Define usable record rate as the share of records where every P0 field is filled. It is the only metric that maps one-to-one onto can this row go into the report, and it should be the gate’s primary threshold.
def usable_rate(records, p0_fields):
    if not records: return 0.0
    ok = sum(1 for r in records if all(field_filled(r, f) for f in p0_fields))
    return ok / len(records)

def staleness_p95(records, ts_field, now=None):
    """Return P95 age in hours; None means no usable timestamps."""
    now = now or datetime.now(timezone.utc)
    deltas = []
    for r in records:
        ts = r.get(ts_field)
        if not ts: continue
        t = datetime.fromisoformat(str(ts).replace("Z", "+00:00"))
        deltas.append((now - t).total_seconds() / 3600)
    if not deltas: return None
    deltas.sort()
    return deltas[max(0, int(round(0.95 * len(deltas))) - 1)]
Write the freshness SLO as a distribution, not a boolean
Is the data real time cannot be alerted on, because real time has no quantified definition. The executable version is: P95 staleness of P0 fields is at most X hours. Use P95 rather than the mean because the mean hides the tail — a distribution with a 20-minute P50 and a 31-hour P95 can produce an excellent average while a meaningful slice of your report is a day old. What “real time” should mean and how to monitor it is what we work through in the real-time Amazon data API article.
Five quantities, one function
Five numbers in isolation mean nothing; the gate needs a boolean. Here is the complete gate: records in, metrics plus a release decision out.
P0 = ["asin", "title", "price.amount", "availability.status"]
P1 = ["brand", "rating.value", "review_count", "bsr.rank_main"]
FRESHNESS_FIELD, SLO_P95_HOURS = "collected_at", 6.0

def gate(records):
    m = {
        "n":             len(records),
        "coverage_p0":   coverage(records, P0),
        "fill_p0":       fill_rate(records, P0),
        "fill_p1":       fill_rate(records, P1),
        "usable":        usable_rate(records, P0),
        "staleness_p95": staleness_p95(records, FRESHNESS_FIELD),
    }
    m["pass"] = (
        m["fill_p0"] >= 0.95
        and m["usable"] >= 0.90
        and m["staleness_p95"] is not None
        and m["staleness_p95"] <= SLO_P95_HOURS
    )
    return m
Note the explicit is not None check. When the timestamp field is absent, staleness_p95 returns None. Skip that check and None <= 6.0 raises in Python 3, while in an implementation with loose validation it evaluates to False and fails the batch with no error. The second outcome is worse than the first, because it makes data with no timestamp at all look like it failed a freshness check it never took.
The gate function, together with the coverage and fill-rate scripts above, is already a runnable Python job. Turning those loose functions into a scheduled task with retries and alerts is covered in Amazon data API with Python.
What granularity should the gate run at
One design choice decides whether the gate survives contact with production: judge per record or per batch. Per record suits pre-write cleaning — a record failing P0 is not written. It is clean, but it loses data, and it cannot distinguish this whole batch is broken from this one row happened to be empty. Per batch suits release decisions — a batch whose usable rate falls below threshold is held back in full, which catches systemic decay but also blocks the good records inside it.
Do both. Record level marks, batch level decides. Collapsing the two into one switch either loses data or misses decay. Run record-level marking first, then batch-level decision, so that when a batch is held you can name in one query which class of record dragged it down.
Stratify the sample or the aggregate lies to you
This is the subtlest trap in the whole gate. Suppose your sample is 70% books and 30% apparel. Books fill the price field 96% of the time; apparel, with its variants and missing variant prices, fills it 58%. Aggregate them and you see 84% — a number that looks acceptable and conceals in full the fact that apparel is unusable.
So the fixed regression sample must be stratified by object characteristics: by category, by whether the product has variants, by marketplace, by price band, with enough volume in each stratum to produce a standalone conclusion. Which dimensions matter depends on your business — stratify by category if value concentrates in a few categories, by marketplace if it concentrates by region. What matters is that every stratum can speak for itself rather than disappearing into a total.
Set thresholds that will not get switched off
The usual way a quality gate dies is that thresholds start too aggressive, the first false alarm fires, and somebody disables it. The fix is to observe for two weeks before setting anything: week one records without blocking, giving you baseline distributions for all four numbers; week two sets an alert line at a sensible tolerance below baseline and a blocking line further down. Thresholds should come from your own distribution, not from a generic best practice. Shipping alerts two weeks later is far cheaper than shipping an alert that gets turned off — and once a gate has been disabled, rebuilding trust in it is much harder than building it the first time.
7. Cost: attribute the invoice to business objects
Most teams know their monthly total and nothing else. That makes optimisation impossible, because you cannot tell which marketplace, object type, or request class to cut.
The effective cost formula
What you are optimising is not unit price, it is cost per thousand usable records: unit price times average attempts per usable record, divided by the usable record rate. That formula ties three variables together — price, stability, completeness. A cheap vendor with a poor usable rate can cost more in the end; an expensive one with full fields and few retries can be the better deal.
Measure the retry amplification factor
Record attempts per record at the collector and aggregate the mean by object type and marketplace. Most teams are surprised the first time they look: plenty assume the factor is close to 1 and measure it between 1.5 and 2.5. It often rises not because failure rates climbed but because backoff policy is triggering retries earlier than it should.
Minimal cost attribution implementation
Attribution does not need a platform. At the collector, write an estimated cost into each record's metadata — call count times unit price, tagged with the object and marketplace the call belongs to. In storage, aggregate along three dimensions: object type, marketplace, date. Those three are enough to answer all but a handful of cost questions: which marketplace is most expensive, which object type is burning money, which week the cost started climbing.
Add usable record counts and you get cost per thousand usable records per object per marketplace instead of one number for everything. That granularity redirects optimisation work — it is common to find that the highest-volume object is not the most expensive per unit, and that the team has been optimising the wrong thing.
Budget guard: write degradation into code
When cumulative daily cost crosses the threshold, cut sampling frequency for non-P0 objects by rule and preserve full collection for P0. Write and test this policy in advance, because deciding under pressure leaves only two options — stop everything or keep burning — and both are bad. The billing basis itself is another trap — per request, per record, or per successful result produces unit prices that can differ by multiples; we compare the four bases in the Amazon data API pricing traps article.
8. Schema change: contract tests inside the pipeline
Upstream field changes happen with no error — renames, type changes, new enum values, merged fields. The damage does not appear at the transport layer; it appears as a number in your report that is wrong with no error raised. There are three defences you can build at the pipeline layer.
One: strict presence and type assertions
Assert on every contract field at the normalisation layer, checking type as well as existence. A field changing from string to object is the most common breaking change, and implicit coercion in a dynamically typed language lets it pass unnoticed. Validation failures should not be skipped without a trace; route them to the soft-fail queue.
Two: weekly structural diffs
Save a response snapshot for a fixed sample every week and diff the structure against the previous week: which paths appeared, which vanished, which types changed. Push the diff to your alert channel. The snapshot doubles as the basis for root-cause analysis — without it, when you need to know when did this field stop populating, memory is all you have.
Three: contract versioning and regression re-runs
The field contract itself carries a version number. When the contract changes, the idempotency key changes with it, re-running affected objects with no manual trigger. Without versioning, a contract upgrade leaves historical records looking already processed and skipping them, so old and new data sit mixed together and nobody notices. For which fields the contract should hold and what the per-object field dictionary looks like, see the Amazon data API JSON schema and field dictionary.
9. Degradation: how the pipeline should behave when upstream is down
Almost nobody writes this section into an architecture doc, and it is the difference between a chaotic incident and an orderly one. Every upstream fails at some point — vendor outage, your own quota exhausted, a network partition, tightened throttling. The question is whether your pipeline responds by delivering less data and saying so, or by pretending to deliver all of it.
Degradation is not a choice between stop and keep burning
With no predefined policy, teams improvise between two options: halt the pipeline and wait, or let retries burn through the budget. Both are bad. Define degradation tiers in advance and let the system switch on conditions.
Three tiers
Tier one, P0 fidelity: P0 collection frequency unchanged, P1 and P2 reduced. Triggers on cost over threshold or rising upstream error rate. Tier two, P0 only: collect P0 objects at reduced frequency, suspend P1 and P2. Triggers when upstream has been unavailable beyond a configured duration. Tier three, archive read-only: stop collection, point downstream at the most recent archive snapshot that passed the gate, and label it in the record as beyond freshness SLO. Trigger conditions, scope, and recovery conditions for all three belong in configuration, not in somebody's memory.
Degraded state must be visible downstream
The dangerous part of degradation is not less data. It is downstream not knowing the data is reduced. Records released by the gate should carry a collection status marker stating which tier they were collected under and which object range was covered. The reporting layer should surface a warning when it sees a degradation marker; the model layer should adjust confidence. Hiding degraded state inside the pipeline means downstream consumes partial data as complete — which is the quiet failure described in section three.
10. Which layers Pangolinfo owns
To be precise and avoid the wrong expectation: we own layer one and the stability that comes with it. The quality gate at layer five is yours to build regardless of whose collection service you use.
What we own
Handing us the collection layer means page redesigns, anti-bot evasion, proxy pool operations, and browser fingerprinting stop being your engineering problems. Our published numbers: a median latency of about three seconds, 99% success rate, and more than 30 million calls a day. On sponsored ad placements — the hardest object to collect by common agreement — we hold 91.4% aggregate coverage across 13 marketplaces, a figure that reflects treating collection coverage as a product metric rather than a side effect. Fields for product, search, and review objects are documented field by field, so you can run the section six scripts against us and measure our coverage and fill rate yourself.
Three things we do not do
First, no account-domain data: orders, inventory, and your own advertising fall inside the official SP-API's authorisation scope, and we neither provide them nor provide a way around them. Second, we do not collect buyer personally identifiable information. Third, we do not collect anything behind a login. These are design boundaries, not roadmap items.
They are the narrow end of a broader compliance question — legal to fetch is not the same as safe to keep or safe to sell. The full checklist across collection, storage, and use is in the Amazon data API compliance checklist.
One case where you may not need a pipeline at all
If the consumer is an AI agent rather than a fixed report, building a full pipeline may be over-engineering. Agents fetch on demand, in response to each request, with an unpredictable field scope, which does not match the pipeline's assumptions of batch processing, fixed schemas, and periodic collection. In that case the better shape is to expose data capability as tools the agent calls when it needs them — which is why Amazon Data MCP exists: 19 tools over remote HTTP, zero installation. Agent scenarios still need quality judgement, of course; it just moves from a gate inside the pipeline to field-validation guidance on the agent side.
When you should not use us
Three situations, stated without hedging. One: you need a very small volume at low frequency, where a few lines of your own script beat us. Two: your requirements sit inside your own accounts, where SP-API is both more compliant and cheaper. Three: you need login-gated data or buyer PII, which we do not do and no vendor should. Ruling out the wrong fits is what makes the remaining scope worth the maintenance you save.
11. The 90-minute implementation checklist
If you want this running next week, do it in this order. Every step has a concrete artefact.
- Write the field contract (20 min). List the fields the business depends on, graded P0/P1/P2. Keep P0 under 15; more means you have not decided what matters.
- Set the freshness SLO (10 min). Give P0 fields a P95 staleness ceiling and write it down. Without that number, freshness cannot be alerted on.
- Build collector plus raw archive (20 min). Fetch and store only, no judgement. This is far less code than most people expect.
- Run a baseline (20 min). Take 200 to 500 real ASINs and compute the four numbers with the section six scripts. This is your baseline, not an acceptance result.
- Wire the gate and alerts (20 min). Record without blocking first, observe for two weeks, then set alert and block lines from the baseline distribution.
Five steps and you have a pipeline that complains when data decays. Everything else — cost attribution, schema contract tests, weekly regression — bolts onto this skeleton.
One last warning: the step most likely to be abandoned halfway is step four, the baseline. The temptation is to skip it and turn alerts on in week one, on the grounds that we can tighten it later. But skipping the baseline means guessing thresholds, and guessed thresholds get disabled after the first false alarm. Better to ship alerts two weeks late than to ship an alert that gets switched off.
Questions teams ask
Does an Amazon data pipeline still need maintenance once you stop running scrapers?
Yes, but the object of maintenance changes. Parsing and anti-bot evasion at the collection layer can be outsourced; data quality governance cannot. Fields going null with no error, data going stale with no alert, and retries inflating cost all require monitoring you build yourself. What transfers is collection, not the judgement of whether data is still usable.
How many layers does a standard Amazon data pipeline API architecture have?
Six. Collection fetches raw responses only; raw archive preserves the basis for replay; queue and retry routes by error class; normalisation and storage enforce the contract and write with idempotency; the quality gate uses four numbers to decide release; monitoring and budget own panels, alerts, weekly regression, and cost attribution.
Why is data still unusable when the API returns 200?
Because transport success is not content usability. The response may be valid JSON with critical fields null, or may pass schema validation while carrying values from three days ago. These silent failures raise no exception, so only field-level fill rate and staleness distribution monitoring can surface them — which is why a quality gate is required.
How do you stop retries from inflating Amazon data API costs?
Route by error class: retry only throttling and server errors, send authorisation and parameter errors straight to dead letter, and put 200 responses with empty critical fields into a soft-fail queue. Add jitter to backoff to avoid retry storms, and monitor mean attempts per record as your amplification factor.
How do you detect schema changes early in a data pipeline?
Three defences: strict presence and type assertions at the normalisation layer; weekly response snapshots for a fixed sample with structural diffs pushed to alerts; and contract versioning so changes re-run affected objects with no manual trigger instead of letting old and new data mix with no error.
External references: Amazon Selling Partner API official documentation (authorisation model and per-operation rate limiting), Amazon conditions of use and robots guidance, Pangolinfo published service metrics and internal measurements.
Next step: run the section 11 checklist to get your own baseline for the four numbers before deciding whether to outsource collection. For public product and search objects, use Amazon Scraper API; for reviews, Amazon Review API; to let an agent fetch in one call and skip pipeline construction, Amazon Data MCP. Start with an API key from the console and run a baseline, or read the Amazon Data MCP technical documentation. For the higher-level selection framework, see Amazon Data API: The Complete Buyer's Guide.