
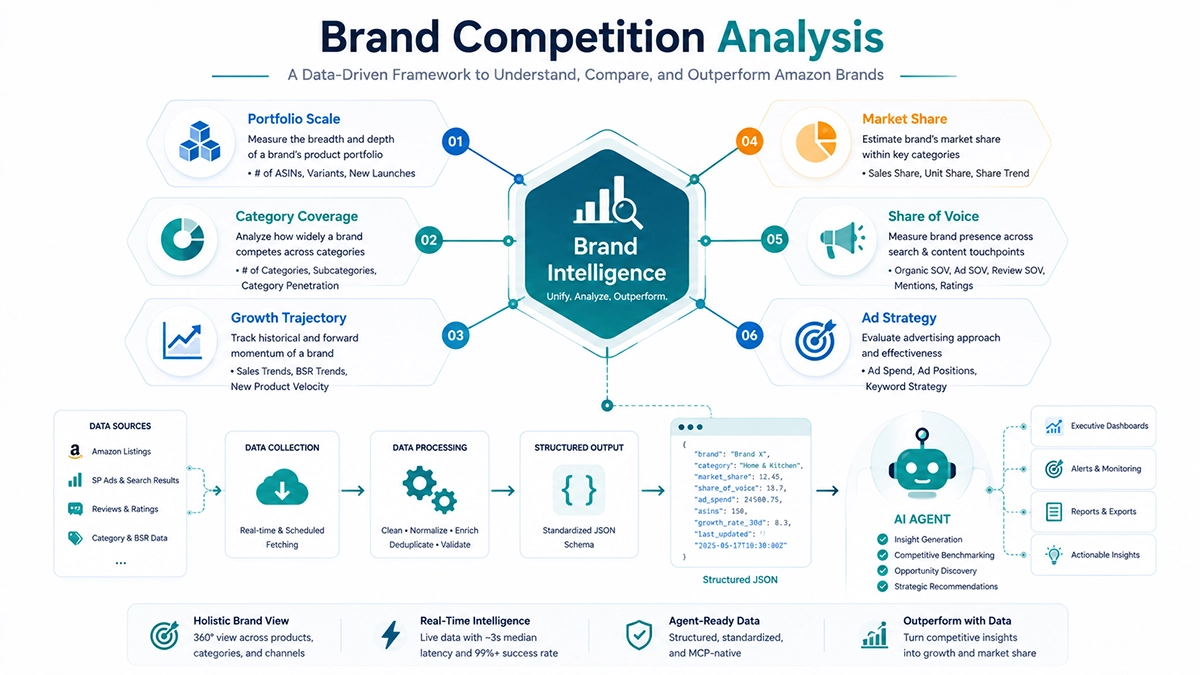
The core of Amazon brand competition data analysis is upgrading from single-ASIN competitor analysis to brand-level competitive intelligence. The questions you need to answer shift from “what’s this ASIN’s price” to “how large is this brand’s portfolio in the category, what’s its market share, where is its ad budget going, and is its growth trajectory up or down.” This requires six dimensions of analysis: portfolio scale, category coverage, market share estimation, share of voice tracking, brand-level ad strategy, and growth trajectory. Most SaaS tools remain at the ASIN level, lacking brand-level aggregation. The viable solution is building a brand-level data pipeline with real-time scraping API, enabling AI Agents to perform brand competitive intelligence via MCP.
At Pangolinfo, I’m seeing more and more brand sellers. A clear trend: brands doing $10M+ annually care less about individual ASIN price changes and more about their brand’s competitive position in the category. “Is our brand’s market share in Wireless Earbuds growing or shrinking?” “How many new ASINs did competitor brand Anker launch in the past three months?” “Which keywords did another competitor brand recently increase ad spend on?” These questions can’t be answered by single-ASIN analysis. They require brand-level data aggregation and competitive analysis.
But when you try to do brand-level analysis with existing tools, you hit an awkward reality: most tools are designed from an ASIN perspective, not a brand perspective. Helium 10 and Jungle Scout center on individual ASIN keywords, rankings, and sales. SmartScout is the best brand-level intelligence tool currently available, aggregating revenue estimates and market share by brand, but its data is still estimated, not real-time. And as of July 2026, no major SaaS tool provides MCP integration, so AI Agents can’t directly consume brand competition data.
This article solves one problem: give you a complete framework for brand-level competition data analysis, showing what dimensions to analyze, how to acquire data, and how to build an automated monitoring system. And show you how to turn brand competitive intelligence into a continuously running data pipeline using real-time API and AI Agents.
How Is Brand Competition Analysis Different from ASIN Competitor Analysis?
Before covering methods, let’s clarify the boundary. Many sellers equate “competitor analysis” with “looking at competitor Listings,” but single-ASIN competitor analysis and brand competition analysis are different abstraction levels requiring completely different data dimensions and methods.
Single-ASIN competitor analysis focuses on one ASIN: its price, BSR, review count, ad keywords. It answers “how is this product doing.” This is the analysis you do when selecting products or optimizing a single Listing.
Brand competition analysis focuses on the brand’s overall competitive landscape: how many ASINs does the brand have, which categories are they in, what’s the brand’s market share in the target category, what’s the overall ad strategy, what’s the growth trajectory over the past year. It answers “how strong is this brand in our market and where is it heading.” This is the analysis brand owners do for annual strategic planning, category expansion decisions, and competitive response strategies.
The data requirements differ significantly. ASIN analysis needs a deep snapshot of one ASIN. Brand analysis needs aggregated data across multiple ASINs. You can’t just look at 50 ASINs under a brand individually and mentally summarize — you need systematic data collection and aggregation to distill scattered ASIN data into brand-level competitive insight.
A real scenario: you’re a bluetooth earbuds brand doing $20M annually. You want to understand the competitive landscape of competitor brands (Soundcore, Jabra, EarFun). You can’t just look at one of their ASINs’ BSR — you need to know each brand’s total ASIN count in the bluetooth earbuds category, price band distribution, BSR distribution, ad placement coverage, and new product velocity over the past six months. Only when aggregated to the brand level can you judge which brand is expanding, which is contracting, which is moving upmarket, which is racing to the bottom on price.
Six Core Dimensions of Brand Competition Data Analysis
This six-dimension framework was distilled from coaching brand sellers. Each dimension answers a brand-level competitive question. Together, they form a complete brand competitive profile.BrandIntelligencePortfolio ScaleASIN count·price bandsvariants strategyCategory Coveragecross-categorysubcategory penetrationMarket Sharerevenue shareBSR concentrationShare of Voicekeyword coveragead placement shareAd Strategykeyword distributionbudget estimationGrowth Trajectoryrevenue trendnew product velocity
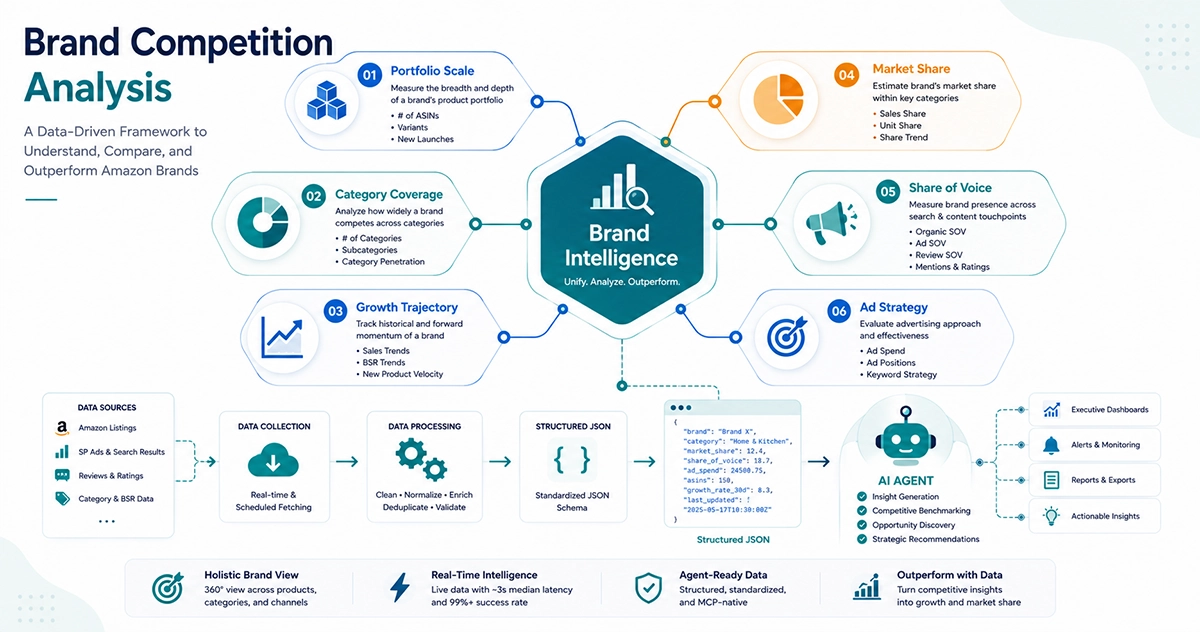
Figure 1: Brand competition data analysis six-dimension framework
Dimension One: Portfolio Scale and Distribution
This is the starting point. You need to know how many ASINs a brand has on Amazon, how those ASINs distribute across price bands, and what the variant strategy is.
ASIN count directly reflects market investment intensity. A brand with 200 ASINs and one with 5 ASINs have completely different market strategies. The former may be covering long-tail demand with a broad catalog, the latter focusing on hero products. Price band distribution reveals brand positioning — full-spectrum coverage or concentrated in one tier. If most of a brand’s ASINs cluster at $20-$30, it’s mid-market. If it simultaneously has many ASINs at $50-$80, it’s pushing upmarket.
Variant strategy also matters. A brand whose ASINs average 20 variants each (color/size combinations) has very different supply chain complexity and inventory risk than one with 2 variants per ASIN. High variant counts usually indicate stronger supply chain backing but also higher inventory exposure.
Dimension Two: Category Coverage Breadth
Brand competition doesn’t happen in just one subcategory. A brand may have products across multiple categories — Anker has products in chargers, bluetooth earbuds, smart projectors, and more. Category coverage breadth reflects diversification and expansion direction.
Analysis needs to answer: which categories does the brand have ASINs in? How many ASINs per category? Which are core strongholds (many ASINs, good BSR) and which are tentative entries (few ASINs, poor BSR)? Has the brand recently entered new categories or exited any?
If a competitor brand suddenly launches many new ASINs in your category, it signals increased investment and you need to be alert. Conversely, if a brand’s ASIN count in your category is declining, it may be retreating — potentially your opportunity to capture share.
Dimension Three: Market Share Estimation
Market share is the most critical and hardest-to-obtain metric in brand competition analysis. Amazon doesn’t disclose real sales by brand, so all market share data is estimated.
The estimation method: get the Top 100 or Top 500 ASIN list from Best Sellers, identify each ASIN’s brand, estimate each ASIN’s sales from BSR, aggregate by brand, calculate market share. Error sources are numerous: BSR-to-sales mapping has 20-50% error, Best Sellers only covers Top 100, new products have volatile BSR. When you aggregate 100 ASINs’ estimates to brand level, errors may compound.
A more reliable approach: track market share trends rather than absolute values. Even if you don’t know whether brand A’s share is exactly 15% or 18%, if you can see it dropped from 20% six months ago to 15% now, that decline is sufficient for decision-making. Real-time scraping APIs help you continuously track Best Sellers brand ASIN counts and rank distribution, judging market share direction from trends.
Dimension Four: Share of Voice Tracking
Share of Voice (SOV) is a brand’s visibility share in specific keyword search results. If 5 of the top 20 results for a keyword belong to brand A, brand A’s SOV for that keyword is 25%.
SOV is easier to obtain in real-time than market share, and it’s a leading indicator — rising SOV typically precedes rising market share. Tracking brand SOV changes across core keywords can reveal competitive landscape shifts before they show up in sales data.
SOV includes organic ranking share and ad placement share. Organic share reflects Listing optimization and sales performance. Ad share reflects ad investment intensity. Pangolinfo achieved 98% SP ad placement collection rate, industry leader. By collecting search results at different time points, you can track each brand’s SOV trend.
Dimension Five: Brand-Level Ad Strategy
Single-ASIN analysis might show you which keywords one ASIN advertises on. Brand-level analysis requires aggregating ad data across all the brand’s ASINs to see the overall ad strategy.
Key metrics: how many keywords does the brand advertise on (coverage breadth)? Which keywords get the most ad placements (investment focus)? What’s the placement preference (top-of-search vs. product-page)? Is the brand’s ad coverage expanding or contracting recently?
If a brand starts advertising on many new keywords, it may be testing new traffic channels or preparing to push new products. If a brand suddenly contracts ad coverage, it may be budget-constrained or repositioning. These brand-level ad strategy changes are invisible in single-ASIN analysis.
Dimension Six: Growth Trajectory
The first five dimensions are static snapshots. The sixth is dynamic trend. You need to continuously track changes in brand key metrics to judge growth trajectory.
Key trend metrics: total ASIN count changes (expanding or contracting), average BSR changes across the brand’s ASINs (competitiveness rising or falling), ASIN count in Best Sellers (market share trending), new product velocity (accelerating or slowing), review growth curve (sales pace changes).
Continuously tracking these metrics requires an automated data pipeline. Manual periodic checking is unrealistic — one category may have dozens of brands with dozens of ASINs each, and weekly checks take hours. Real-time scraping API with scheduled tasks can automatically perform brand portfolio scans, metric aggregation, and trend detection.
Three Structural Defects of Current Brand Analysis Tools
When you try to do brand-level analysis with existing tools, you hit three structural defects. These aren’t about any tool being poorly built — they’re determined by tool design perspective and business model.
Defect One: ASIN Perspective Limitation — Most Tools Stay at Single-Product Level
Helium 10 and Jungle Scout center on individual ASINs: keyword tracking, rank monitoring, Listing optimization, sales estimation. Their Market Tracker features can track a group of ASINs, but it’s essentially “multiple single products displayed side by side” rather than “brand-level aggregated analysis.” You see 50 ASINs’ individual rankings and sales, but not “what’s brand A’s overall market share.”
SmartScout is currently the best brand-level intelligence tool. Its Brands tool aggregates revenue estimates, ASIN counts, and market share by brand — one of the few tools designed from a brand perspective. But SmartScout’s data is still estimated, not real-time. And its premium pricing suits brands doing $10M+ annually.
The core problem: most tools’ data models are ASIN-centric, with brand as just an attribute field. To do brand-level analysis, you need to aggregate ASINs by brand first, then calculate brand-level metrics. This aggregation logic requires you to implement it yourself — either manually in Excel or programmatically via API.
Defect Two: Estimation Error Amplification — Brand-Level Errors Compound
Single-ASIN sales estimation error is 20% to 50%. When you aggregate multiple ASINs’ estimated sales to brand level, errors don’t disappear — they may compound. Assuming brand A has 100 ASINs, each with ±30% estimation error. Since different ASINs’ errors may offset, aggregated error shrinks statistically but doesn’t vanish. More critically, systematic biases in the estimation model (e.g., systematic overestimation of long-tail ASINs) accumulate when aggregated.
This means “brand A monthly revenue: $5M” could actually be anywhere from $3.5M to $6.5M. Making market share or competitive strategy decisions based on this number carries significant uncertainty.
The solution isn’t pursuing more precise estimation models — it’s changing the data acquisition approach. Real-time scraping APIs don’t estimate sales. They return real data: BSR, price, ad placements, review counts. You can aggregate these real data points to brand level: “Brand A has 120 ASINs, 35 in Best Sellers Top 100, average BSR 4,500, ad coverage across 45 keywords.” These metrics are real, not estimated.
Defect Three: No Real-Time Brand Monitoring — Data Lags 1-7 Days
Brand competitive landscape changes may be slower than individual ASIN changes, but when they happen, the impact is larger. A competitor brand suddenly launching 20 new ASINs in your category is a critical signal, but SaaS tools may take 3-7 days to reflect it on dashboards.
More critically, brand-level monitoring requires continuous tracking of multiple dimension trends. BSR changes, ad placement changes, new product velocity, review growth curves — these trend signals need high-frequency collection to capture. SaaS tools’ daily update frequency is far from sufficient.
The Amazon Scraper API enables hourly collection. Combined with the Niche Data API for category trees and Best Sellers data, you can build a complete brand competition monitoring system: periodically scan category rankings, identify brand ASIN portfolios, collect full-dimension data, aggregate to brand level, track trend changes, and auto-alert on anomalies.
Building a Brand Competition Data Analysis System with Real-Time API
The Python code below demonstrates a brand competition analysis system: scan category Best Sellers, aggregate ASINs by brand, collect full-dimension data, and calculate brand-level competitive metrics.Data Collection LayerNiche Data API (category trees/Best Sellers) + Scraper API (ASIN full-dimension real-time)Brand Aggregation LayerGroup ASINs by brand → calculate brand-level metrics (ASIN count/price bands/BSR concentration/ad coverage)Output: competitive profile snapshot per brandCompetitive AnalysisMarket share estimationShare of voice trackingBrand-to-brand comparisonTrend MonitoringGrowth trajectory trackingAnomaly alertsNew product detectionOutput: Brand competition reports / Dashboards / AI Agent natural language queries / Alert pushesMCP 19 tools, Agent can perform all analysis via natural language
import requests
import json
from datetime import datetime
from collections import defaultdict
from concurrent.futures import ThreadPoolExecutor

API_ENDPOINT = "https://api.pangolinfo.com/v1/amazon"
API_KEY = "YOUR_API_KEY"

def scan_category_bestsellers(category_node, country="US", limit=100):
    """Scan category Best Sellers list for ASINs"""
    resp = requests.get(
        f"{API_ENDPOINT}/bestsellers",
        headers={"Authorization": f"Bearer {API_KEY}"},
        params={"category": category_node, "country": country, "limit": limit}
    )
    return resp.json().get("asins", [])

def fetch_asin_with_brand(asin, country="US"):
    """Fetch ASIN full-dimension data with brand info"""
    resp = requests.get(
        f"{API_ENDPOINT}/product/{asin}",
        headers={"Authorization": f"Bearer {API_KEY}"},
        params={"country": country, "fields": "bsr,price,brand,coupon,stock,ads,reviews,rating"},
        timeout=10
    )
    data = resp.json()
    return {
        "asin": asin, "brand": data.get("brand", "Unknown"),
        "bsr_main": data.get("bsr", {}).get("main"), "price": data.get("price"),
        "ads_count": len(data.get("ads", [])), "reviews_count": data.get("reviews_count"),
        "rating": data.get("rating"), "timestamp": datetime.now().isoformat()
    }

def aggregate_by_brand(asin_data_list):
    """Aggregate ASIN data by brand, calculate brand-level metrics"""
    brands = defaultdict(list)
    for item in asin_data_list:
        brands[item["brand"]].append(item)
    brand_profiles = []
    for brand, asins in sorted(brands.items(), key=lambda x: -len(x[1])):
        prices = [a["price"] for a in asins if a["price"]]
        bsrs = [a["bsr_main"] for a in asins if a["bsr_main"]]
        brand_profiles.append({
            "brand": brand, "asin_count": len(asins),
            "price_min": min(prices) if prices else None,
            "price_max": max(prices) if prices else None,
            "avg_bsr": sum(bsrs)/len(bsrs) if bsrs else None,
            "total_ads": sum(a["ads_count"] for a in asins),
            "total_reviews": sum(a["reviews_count"] or 0 for a in asins),
            "bestseller_share": len(asins) / len(asin_data_list)
        })
    return brand_profiles

def analyze_brand_competition(category_node, country="US"):
    """Complete brand competition analysis flow"""
    asin_list = scan_category_bestsellers(category_node, country)
    with ThreadPoolExecutor(max_workers=10) as executor:
        results = list(executor.map(fetch_asin_with_brand, asin_list))
    results = [r for r in results if r]
    profiles = aggregate_by_brand(results)
    for p in profiles[:10]:
        print(f"  {p['brand']}: {p['asin_count']} ASINs, "
              f"${p['price_min']}-${p['price_max']}, "
              f"avg BSR={p['avg_bsr']:.0f}, "
              f"ads={p['total_ads']}, "
              f"share={p['bestseller_share']*100:.1f}%")
    return profiles

profiles = analyze_brand_competition("electronics/172282")
The core value is in aggregate_by_brand. It aggregates ASIN-level data to brand level, calculating each brand’s ASIN count, price band distribution, average BSR, total ad coverage, total reviews, and Best Sellers list share. These brand-level metrics aren’t directly provided by SaaS tools — you need to aggregate them yourself.
bestseller_share is a particularly practical brand-level metric. It represents how many positions a brand occupies in the category’s Best Sellers Top 100. While not equal to precise market share, its trend highly reflects brand competitiveness changes. If a brand’s bestseller share drops from 15% to 8% over six months, its market share is very likely declining too.
Brand Competitive Intelligence in the AI Agent Era
Brand competition analysis involves extensive data collection and aggregation — naturally suited for AI Agent automation. But as of July 2026, SmartScout, Helium 10, and Jungle Scout have not shipped MCP Servers. Agents can’t directly consume their brand data.
The Amazon Data MCP provides 19 tools via remote HTTP with zero installation. After configuration, you can drive brand competition analysis in natural language:
“Scan Wireless Earbuds Best Sellers Top 100, aggregate by brand, calculate each brand’s ASIN count, price band distribution, and ad coverage, then compare my brand against the top 5 competitors and find where we’re behind.”
The Agent automatically: calls the category tool for Best Sellers ASINs, calls product detail tool for batch full-dimension collection, aggregates by brand, compares with your brand data, and outputs a structured competitive report. No code. No manual tool switching.
More importantly, continuous monitoring. Brand competitive landscape changes are gradual — you need sustained tracking to spot trends. Configure once: “Scan this category’s brand portfolio weekly. Alert me if any brand’s ASIN count changes more than 20% or bestseller share changes more than 5%.” The Agent runs scans, comparisons, and judgments automatically, pushing alerts when thresholds are met. You shift from “periodically doing brand research manually” to “being proactively notified of competitive landscape changes.”
The fundamental shift: brand competitive intelligence transforms from “a project requiring a team days to complete” into “a continuously running data pipeline.” The pipeline’s input is Niche Data API and Scraper API, processing layer is brand aggregation and competitive analysis logic, output is your decision panel and alert channels. The pipeline keeps running. You only make decisions when signals appear.
Frequently Asked Questions
What dimensions does Amazon brand competition data analysis include?
Brand competition data analysis includes six core dimensions: portfolio scale and distribution (ASIN count, price band distribution, variant strategy), category coverage breadth (cross-category presence, subcategory penetration), market share estimation (revenue share, BSR concentration), share of voice tracking (keyword ranking coverage, ad placement share), brand-level ad strategy (keyword distribution, placement preferences, budget estimation), and growth trajectory (12-month revenue trend, new product velocity, review growth curve). These six dimensions form a complete brand competitive profile.
What’s the difference between brand competition analysis and ASIN competitor analysis?
ASIN competitor analysis focuses on a single ASIN’s price, BSR, reviews, and ads, answering “how is this product doing.” Brand competition analysis focuses on the brand’s overall competitive landscape, answering “how strong is this brand in our market and where is it heading.” Brand-level analysis requires aggregating multiple ASINs’ data to the brand dimension, involving portfolio scale, category coverage, and market share metrics. Most SaaS tools remain at the ASIN level, lacking brand-level aggregation capabilities.
How to calculate Amazon brand market share?
Precise brand market share can’t be obtained directly since Amazon doesn’t disclose real sales by brand. Two estimation methods: derive each ASIN’s sales from BSR then aggregate by brand (BSR estimation error 20-50%), or use each brand’s ASIN count and rank distribution in Best Sellers lists to estimate relative share. Real-time scraping APIs can collect more accurate brand portfolio data to aid market share judgment. More practical approach: track market share trends rather than pursuing absolute precision.
Can SmartScout and Helium 10 do brand competition analysis?
SmartScout is currently the strongest brand-level intelligence tool, providing brand revenue estimates, market share, and brand scores. But data is estimated, not real-time, and pricing is premium. Helium 10’s Market Tracker 360 provides share of voice tracking but focuses on predefined ASIN sets rather than brand-wide analysis. Neither offers MCP integration for AI Agents. As of July 2026, no major SaaS tool provides brand-level MCP access.
How to use AI Agents for brand competition analysis?
Through Amazon Data MCP (19 tools, remote HTTP, zero installation), AI Agents can perform brand competition analysis using natural language. For example: “Scan the Top 100 brands in this category, calculate each brand’s price band distribution and BSR concentration, and find the 3 brands with fastest market share growth.” The Agent orchestrates collection, aggregation, and analysis automatically. Requires Niche Data API for category trees and Best Sellers data.
Summary and Next Steps
Brand competition data analysis is the necessary upgrade from single-ASIN competitor analysis to brand-level competitive intelligence. When your business scales from “selling a few products” to “operating a brand,” what you care about shifts from individual ASIN price fluctuations to the brand’s overall competitive position and growth trajectory in the category.
The six-dimension framework — portfolio scale, category coverage, market share, share of voice, ad strategy, growth trajectory — provides a complete brand competitive profile. Current SaaS tools have structural shortcomings across these dimensions: ASIN perspective limitation prevents brand-level aggregation, estimation errors compound when aggregated, and 1-7 day data lag prevents real-time brand monitoring.
Building a brand competition data pipeline with real-time scraping API is currently the only solution that simultaneously delivers brand-level aggregation, real data, real-time monitoring, and Agent friendliness. Here’s what to do: pick one of your categories, scan the Best Sellers Top 100 with the API, aggregate by brand, and see the competitive landscape. You’ll be surprised by some findings — a competitor brand you thought was small actually occupies 15 positions in the list, or a top brand’s new product velocity suddenly slowed over the past three months. These brand-level signals are invisible in single-ASIN analysis.
Article Summary
This article breaks down six core dimensions of Amazon brand competition data analysis (portfolio scale, category coverage, market share, share of voice, ad strategy, growth trajectory), reveals three structural defects of current tools (ASIN perspective limitation, estimation error amplification, no real-time monitoring), and presents a brand competitive intelligence solution using real-time scraping API + Niche Data API + MCP. Includes complete Python code (category scan → brand aggregation → competitive metrics) and AI Agent natural language invocation. Designed for brand owners, agency account managers, and e-commerce data analysts needing brand-level competitive intelligence.
Want to build a brand-level competitive intelligence system? Try Pangolinfo Amazon Scraper API, combine with Niche Data API for category data, or learn how Amazon Data MCP lets AI Agents perform brand competition analysis via natural language.View API Documentation
Author: Leo, Technical Lead / Chief Architect at Pangolinfo. Processing 30M+ daily data requests. This article is based on the Pangolinfo team’s practices in brand-level competition analysis scenarios.