
Black Friday 2026 Data Playbook (2/4). Previous: What Amazon Sellers Should Track in Real Time. Next: Three Real-Time Data Feeds.
If you still think of Black Friday as “November 27,” this year’s numbers will cost you.
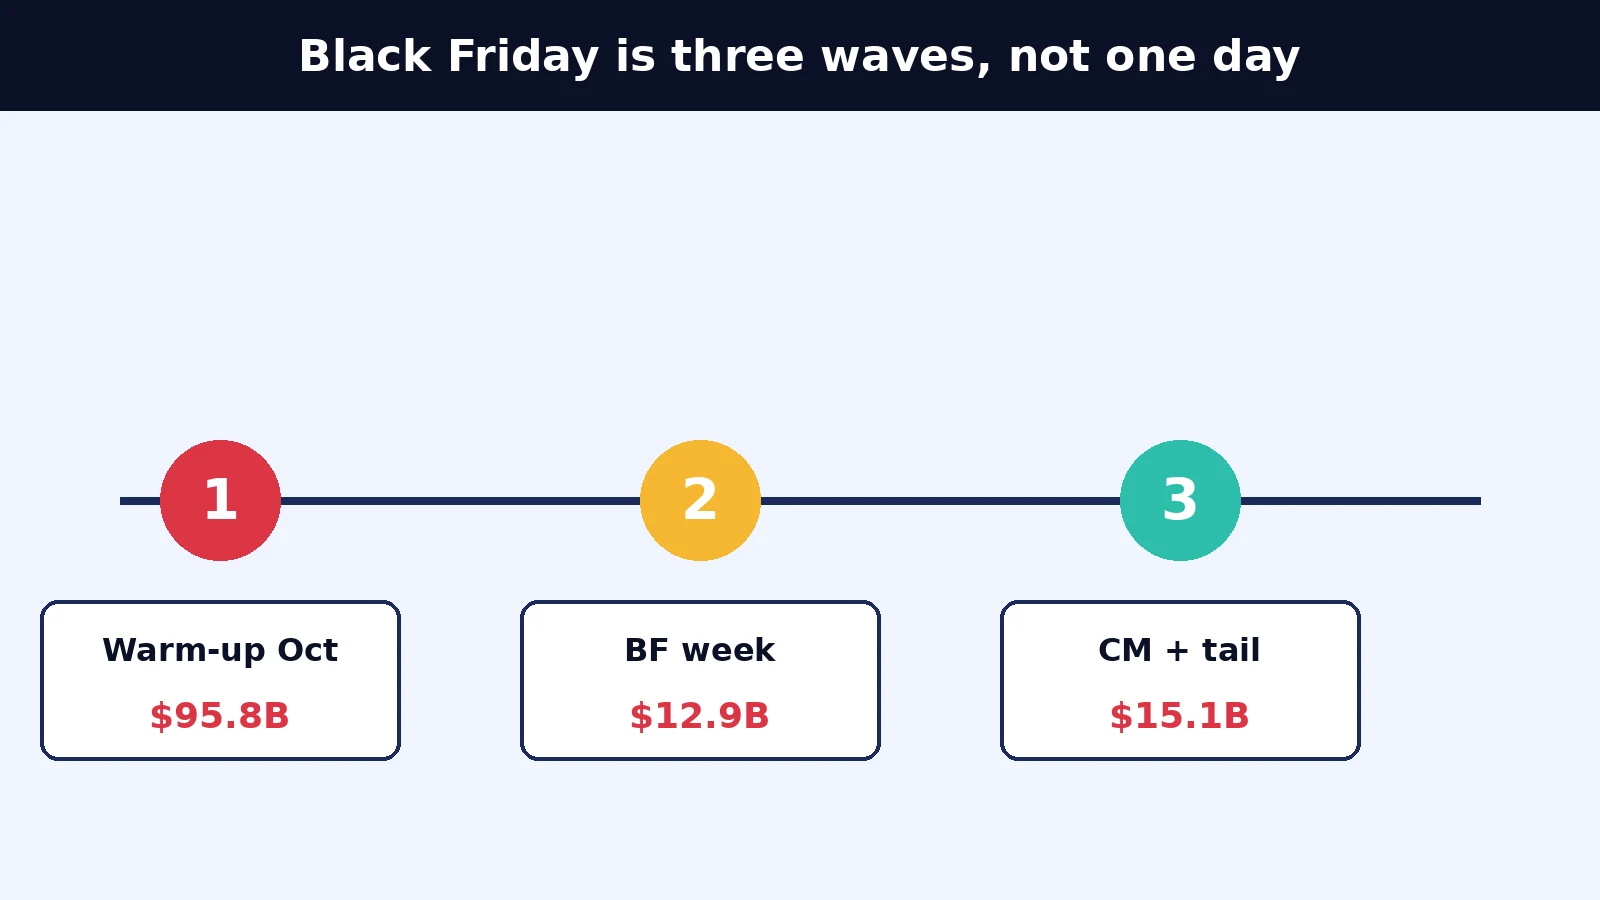
Look back at 2025: Black Friday brought $11.8 billion online (up 9.1%), Cyber Monday $14.25 billion, and Cyber Week $44.2 billion. Now the 2026 forecast from Adobe: $12.9 billion for Black Friday (+9.2%), $15.1 billion for Cyber Monday (+6.2%), and $95.8 billion in October alone (+8%). Adobe also says Black Friday is growing faster than Cyber Monday, partly because it carries the season’s deepest discounts in categories like TVs, apparel and appliances.
The peak is moving earlier and the battlefield is getting longer. Split it into three waves, and the data you need in each is completely different.
Wave 1: warm-up (now to about November 19)
What buyers are doing. They’ve already started buying. Adobe reported $9.86 billion in U.S. online spend during Prime Big Deal Days (October 6–7), up 8.5%, with electronics 85% above September’s average, toys 158%, and video games 90%. Pattern’s report also noted that gift-related searches such as “stocking stuffers” and “Christmas gifts for grandkids” jumped in October.
An earlier reference point: Jellyfish’s 2024 data showed “Black Friday Deals” searches climbing from late September and peaking in the third week of November, ranking as the 36th most-searched term on Amazon U.S.
The nature of this wave: buyers are collecting and comparing, not yet committing. What you earn here is ranking weight, reviews, and a price baseline.
What to watch:
| Data | Why | What to look at |
|---|---|---|
| Competitor price bands and coupons | Establish a “normal price” baseline so you can tell who is really discounting later | Take-home price, list price, coupon value |
| Search results for gift and event keywords | See who holds organic and sponsored positions | Organic and SP/SB/video placements recorded separately |
| Competitor reviews and Customer Says | Find selling-point gaps your listing can fill, for search and for Alexa | Latest 1–2 star reviews, review tags |
| Front-end view in key zip codes | National averages hide regional differences | e.g., New York 10001, Los Angeles 90001 |
What to decide: Before the listing freeze (around November 9, a common seller practice, not an Amazon rule), settle the keywords and selling points you want in titles, bullets and A+ content. Set your Black Friday price range and your floor.
One more detail useful for deal pricing: per PPC Land, October event prices are excluded from the lookback Amazon uses to set Black Friday deal price ceilings, so a Prime Big Deal Days discount doesn’t automatically lower your maximum Black Friday deal price.
Case: a $2.2B footwear and apparel seller. With 30,000+ SKUs, this seller relied on experience for selection and couldn’t pipe third-party data into its ERP. After adopting Pangolinfo, prices, BSR and reviews were collected reliably at a success rate above 99%, standardized JSON reached the ERP within two days, and the selection cycle fell to 8 hours. The price baselines and keyword audits of wave 1 are only feasible across 30,000 SKUs if the data pipeline already works.
Wave 2: Black Friday week (expected November 19–29, unconfirmed)
Amazon hasn’t published 2026 Black Friday week dates. Last year it ran November 20 to December 1. One seller-facing source mentions November 21–29 for Black Friday week and November 29–December 2 for the Cyber Monday event. Sources disagree, so rely on Seller Central.
What buyers are doing. Adobe forecasts $6.9 billion online on Thanksgiving (November 26, +8.5%), with mobile at a record 63% and growth driven by impulse buying. Black Friday itself is forecast at $12.9 billion. This is the commit phase, and buyers are extremely price-sensitive.
The nature of this wave: prices and ad placements change every hour. How much earlier than your competitors you notice decides whether you hold the Buy Box and your ad positions.
What to watch:
| Data | Why | Example trigger rule |
|---|---|---|
| Competitor take-home price (including coupons and deal prices) | A competitor’s drop pulls conversion away from you | If a competitor’s price falls by more than a set amount, alert the ops lead to evaluate a response |
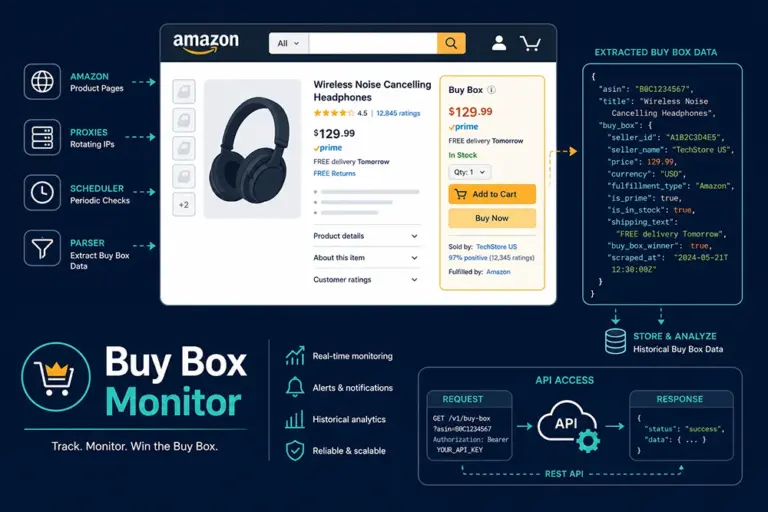
| Buy Box and hijackers | Hijacking can cost you the Buy Box directly | New seller detected on your listing: trigger ops and legal review immediately |
| Competitor stock | A stockout is your window to capture overflow demand | Core competitor stock below threshold: consider raising budget on core keywords |
| SP/SB/video placements on core keywords (hourly, by zip code) | See the real split between organic and paid, and avoid bidding hard when you already rank organically | Lower bids when organic position is strong; alert when a position is taken |
Case 1: a $1.8B GMV mother-and-baby seller. Competitors were hijacking core-keyword ad positions, traffic dropped with no warning, and nationwide averages hid differences between the coasts. They built hourly competitor ad monitoring on Pangolinfo, split by zip code, watching hundreds of long-tail keywords in parallel. Results: 10x better detection of position grabs, average CPC down more than 38%, daily ad spend down 60%.
Case 2: a leading consumer-electronics seller. In 3C categories, hijacking happens at night and competitors change coupons constantly, so next-morning reports come too late. This seller polls 1,000+ ASINs every 5 minutes and writes results straight into Feishu tables, so legal and ops can act in parallel. Reported outcome: time from detecting a hijacker to filing a complaint dropped from 4 hours to 5 minutes, and manual monitoring time fell 80%.
Cost reminder: One service provider estimates the 2025 average Amazon CPC at about $1.12, rising to $1.35–$1.45 in Q4 peaks, and $2–$6+ in competitive categories during Black Friday and Cyber Monday (an estimate, not official data). Every bad bid costs much more this week than usual.
Wave 3: Cyber Monday and after (November 30 to early December)
What buyers are doing. Cyber Monday remains the biggest single day. Adobe forecasts $15.1 billion, the first $15 billion-plus online shopping day. And discounts don’t vanish when the event ends: Adobe’s 2025 data noted that in the first week of December, toys were still up to 23% off, computers 20%, and electronics 19%.
The nature of this wave: two jobs, harvesting the tail and doing the post-mortem. Many sellers stop paying attention here, which wastes the data they just generated.
What to watch:
| Data | Why | What to do |
|---|---|---|
| Price recovery pace | Decide when to return to normal pricing | Restore in steps, not all at once |
| Competitor stockouts and restocks | Slow restockers leave a traffic gap | Increase budget selectively |
| New 1–2 star reviews | Order surges expose quality issues in bulk | Spot defects; decide on a redesign or listing clarification |
| Keyword-level share of voice and placements | Review which terms burned money without results | Cut weak terms and bank the budget for the next round |
| New-release lists and niche categories | Look for Q1 opportunities | Filter for recent listings with few reviews and fast-rising rank |
Case: a $3B GMV multi-category seller. Running 200+ stores and 10,000+ SKUs on a “fast testing plus follow-sell incubation” model, this seller used to spend 5–7 days gathering data and missed follow-sell windows. After adoption, they defined custom filters (for example “new listing plus fast-rising ratings”), refreshed hourly, and generated ready-to-use product tables. They report more than 70% better multi-category research efficiency and a 600% improvement in SKU hit rate.
Five numbers per wave
| Wave | Five numbers to watch |
|---|---|
| Warm-up | Competitor price baseline, organic share on gift keywords, competitor coupon values, latest negative-review themes, key zip-code performance |
| Black Friday week | Competitor take-home price changes, Buy Box owner, hijacker count, competitor stock, ad-placement share on core keywords |
| Cyber Monday and after | Price recovery progress, competitor restock timing, new negative reviews, spend on weak keywords, new-release list changes |
Running this cheaply
All three waves rely on live Amazon front-end information: search results pages (with organic and SP/SB/video placements separated), product detail pages (price, coupon, Buy Box, hijackers, stock), and reviews.
The Pangolinfo Amazon Scraper API supports zip-code targeting, restores 95% of ad placements, responds at roughly 3 seconds P95, and bills only for successful records. Sign up at tool.pangolinfo.com for 60 free Credits a month, no credit card required.
In the next post, we’ll take the price, ad and AI feeds one at a time, with monitoring cadences and a budget calculation.
Sources and notes
- Adobe, 2026 holiday forecast: Adobe, 2026 holiday forecast
- Adobe, 2025 Cyber Monday and Cyber Week: Adobe, 2025 Cyber Monday and Cyber Week
- Digital Commerce 360, Prime Big Deal Days 2026: Digital Commerce 360, Prime Big Deal Days 2026
- Pattern, Big Deal Days search observations: Pattern, Big Deal Days search observations
- Jellyfish, Black Friday 2024 search trends: Jellyfish, Black Friday 2024 search trends
- PPC Land, deal submissions and Adobe forecast analysis: PPC Land, deal submissions and Adobe forecast analysis
- Customer cases: Pangolinfo case page; the consumer-electronics case comes from Pangolinfo’s own materials.
- CPC figures are estimates from the service provider SupplyKick and are indicative only.
Market data as of October 29, 2026. Rely on Seller Central for exact Amazon event dates.