
Executive Summary
In 2026, the global e-commerce industry has crossed the critical threshold of wild growth and entered a new era defined by algorithmic precision, operational compliance, and data velocity. Amazon, as the absolute hegemon of global e-commerce, is expected to account for 60% of U.S. online retail sales. However, for third-party sellers, this seemingly vast market is actually fraught with undercurrents.
With the full deployment of the A12 algorithm, deep integration of the generative AI shopping assistant Rufus, and fundamental reshaping of search logic by the COSMO knowledge graph, traditional Amazon product selection logic based on keyword stuffing and simple sales ranking has completely failed. Meanwhile, the “de-China” trend at the macro policy level—such as the U.S. closure of the De Minimis loophole and increased tax transparency—is reconstructing the underlying cost structure of cross-border trade. Combined with Amazon’s newly effective Inbound Placement Service Fee and Low-Inventory-Level Fee in 2026, sellers’ profit margins face unprecedented pressure.
This whitepaper aims to provide professional sellers and brand owners with a detailed, battle-tested scientific product selection and operational methodology. We will deeply analyze Amazon’s algorithmic black box in 2026, explaining how to use Pangolinfo API to build automated market intelligence systems, combining Google Trends macro trends with TikTok and Instagram social media buzz to achieve a fundamental leap from “intuitive decision-making” to “data-driven decision-making.” In this breakthrough battle from “red ocean” to “blue ocean,” mastering the depth and speed of data will be the only survival rule.
Chapter 1: Global E-commerce Macro Landscape and Market Dynamics in 2026
1.1 Structural Transformation of Global Business Infrastructure
Entering 2026, e-commerce is no longer a “disruptor” of retail but has established itself as the “normative infrastructure” of global business. The market’s main theme has shifted from early “technological gimmicks” to deep “operational discipline.” It is predicted that global retail sales in 2026 will exceed $3.8 trillion and steadily advance toward $4.9 trillion by 2030. The driving force behind this growth is no longer just traffic dividends, but the ultimate optimization of supply chain efficiency and consumer experience.
1.1.1 Structural Speed and Regionalization of Fulfillment Networks
In 2026, the core competitive advantage is defined as “structural speed.” This refers not just to the speed of “last mile” delivery, but to the full-chain flow efficiency from factory production lines to consumers’ hands. To cope with rising logistics costs and meet consumers’ desire for instant gratification, fulfillment networks exhibit significant “distributed” and “regionalized” characteristics. Amazon is forcefully compelling sellers to deploy inventory dispersed to regional fulfillment centers (Nodes) close to consumers through fee structure adjustments. Those sellers who still rely on a single warehouse for nationwide shipping will suffer double blows in delivery timeliness and freight costs.
1.1.2 Data Velocity Replacing Data Volume
In the past big data era, enterprises pursued massive data accumulation. In 2026, however, core competitiveness has shifted to “data velocity”—the time difference from data generation to conversion into decision action. Static monthly or weekly reports have become historical relics; only millisecond-level real-time data streams—covering inventory fluctuations, competitor price adjustments, keyword trend transitions—can eliminate friction in scaled operations. This extreme thirst for real-time capability has directly catalyzed the technological transformation from SaaS interface operations to API automation integration, which will be detailed in Chapter 5 of this report on Pangolinfo API applications.
1.2 Dramatic Changes in Cross-Border Trade Policy and Compliance Environment
Product selection decisions in 2026 must be scrutinized under the microscope of global trade compliance. The disappearance of policy dividends requires sellers’ financial models to have stronger robustness.
1.2.1 End of the “De Minimis” Loophole and Return to Fair Competition
For years, under the U.S. Trade Facilitation and Trade Enforcement Act (TFTEA), goods valued below $800 could enter the United States tax-free (De Minimis rule). This loophole was abused by numerous direct-shipping cross-border platforms and sellers, creating huge cost asymmetry with domestic brands. Between 2025 and 2026, U.S. trade authorities took decisive measures to suspend widespread tax exemptions for large-scale e-commerce packages. This structural correction means that the survival space for the “direct-shipping low-price” model has been extremely compressed, while the traditional, compliant tax-paying FBA large-trade model, though requiring higher upfront investment, has gained a fairer competitive environment.
1.2.2 Tax Transparency and Data Sharing
Meanwhile, compliance fences are tightening. Tax authorities in China, the United States, and other major markets have strengthened data exchange. Amazon has officially notified sellers that it will share specific sales and tax information with Chinese tax authorities according to updated regulations. This change strikes at previously existing gray tax operations, forcing sellers to incorporate fully compliant tariff and VAT costs into consideration at the product selection stage. Those product lines that rely on “tax avoidance” to maintain meager profits will be ruthlessly eliminated by the market.
1.3 Deep Evolution of Consumer Behavior
1.3.1 Trust Economy and Brand Values
Nielsen IQ reports show that 95% of consumers consider “brand trust” a key factor in purchasing decisions. In 2026, consumers no longer easily pay for simple low prices but pay more attention to whether brands convey information aligned with their values, such as sustainability and ethical sourcing. The rise of this “trust economy” directly affects product selection direction—products with environmental attributes (such as Climate Pledge Friendly certification) have natural advantages in traffic acquisition.
1.3.2 Popularization of Augmented Reality (AR) and Immersive Experiences
As AR technology penetration in e-commerce reaches new highs, the related market is expected to reach $38.5 billion by 2030. In fashion, home, and beauty categories, products supporting virtual try-on or 3D visualization have significantly higher conversion rates than ordinary image-text listings. When selecting products, whether a product is suitable for digital display has become a new evaluation dimension.
Chapter 2: Neurosymbolic Evolution of Amazon’s Algorithm Ecosystem
If the A10 algorithm of 2020 focused on “relevance” and “sales,” the A12 algorithm of 2026 has constructed a complex “neurosymbolic” system that not only calculates data but attempts to “understand” business logic and physical world constraints.
2.1 A12 Algorithm: From Sales-Oriented to Profit and Efficiency-Oriented
The core logic of the A12 algorithm has undergone a fundamental shift: Amazon no longer simply recommends products with the highest sales but recommends those that can maximize customer satisfaction while optimizing Amazon’s own “last mile” costs and profit structure.
2.1.1 Hidden Weight One: Shipment Proximity Index (SPI)
This is the most hidden yet deadly ranking factor in 2026. Amazon’s internal system scores based on how many “same-day/next-day delivery zones” a SKU covers.
Mechanism: For the same product, if Seller A disperses inventory across five warehouses in the East, West, and Central U.S. through multi-node inbound configuration, while Seller B only concentrates inventory in a Los Angeles warehouse, even if Seller B’s sales are slightly higher, the A12 algorithm will prioritize recommending Seller A’s product to users in Chicago.
Product Selection Insight: Product selection must consider the product’s logistics attributes. Oversized, overweight, or irregularly shaped products naturally score lower on SPI due to difficulty in low-cost multi-warehouse deployment.
2.1.2 Hidden Weight Two: Real-Time Profitability Indexing
The A12 algorithm introduces “contribution profit” as a ranking signal. The system calculates in real-time a SKU’s net profit after deducting FBA fees, commissions, advertising costs, and estimated return costs.
Mechanism: Products that result in negative gross margins through extreme low pricing (“spiral tactics”) are identified by the algorithm as “unsustainable” or “low quality,” thus suffering traffic dampening. Amazon does not want its prime positions occupied by brands that may disappear at any time due to cash flow breaks.
2.1.3 Hidden Weight Three: Engagement Dwell
Simple click-through rate (CTR) is no longer sufficient to measure intent. The A12 algorithm now calculates “effective dwell time” and “scroll depth” on listing pages.
Mechanism: If users click into a page, read A+ content comparison charts, watch videos, or even click to enlarge images to view details, these interactive behaviors are recorded as positive signals. Conversely, bouncing in and out immediately seriously harms rankings.
Product Selection Insight: Products must have “displayability.” Products with complex functions, rich selling points, and ability to support high-quality video content have more advantages in the A12 era.
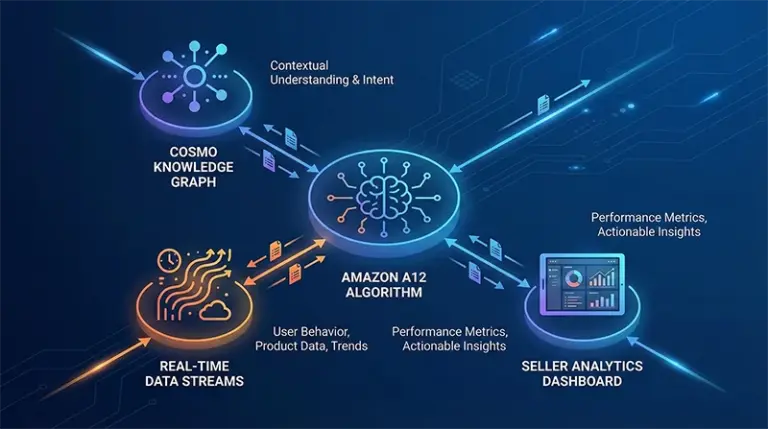
2.2 COSMO and Rufus: From Keyword Matching to Intent Understanding
This is a generational leap in Amazon’s search technology. The combination of COSMO (Common Sense Knowledge Generation) and Rufus (AI shopping assistant) marks the end of the “keyword hegemony” era, replaced by the “knowledge graph” era.
2.2.1 COSMO: Building a Knowledge Graph of Common Sense
In the past, when users searched for “maternity shoes,” the search engine looked for listings containing the characters “maternity” and “shoes.” Now, COSMO uses large language models (LLM) to mine massive user behavior data, constructing “common sense relationships” between products and human behavior, environment, and intent.
Reasoning Analysis: Search “maternity shoes” → COSMO infers that pregnant women’s pain points are “slip-resistant,” “easy to put on (no laces),” “foot swelling (need wide width)” → algorithm prioritizes displaying products with these attributes, even if their titles may not fully match the word “maternity.”
Product Selection Insight: Product selection must be based on specific user scenarios (Context) rather than just keywords. Developers need to think: What specific problem does my product solve in what specific scenario?
2.2.2 Rufus: Conversational Shopping Traffic Entry
Rufus, as a generative AI assistant, is expected to drive 40% of purchasing behavior by the end of 2026. Rufus no longer displays cold product lists but directly answers user questions, such as “Which coffee maker is best for camping?”
Traffic Logic: Rufus captures structured data in listings, sentiment analysis in reviews, and FAQs in A+ pages.
Response Strategy: Products must have clear differentiated selling points, and these selling points must be machine “readable” and “understandable.” If a product has no distinctive features, AI will be unable to recommend it in conversations.
2.3 Advertising Ecosystem Reconstruction: Persona-Based PPC Framework
The advertising system in 2026 has evolved into a “people-oriented” recommendation engine.
Persona-Based PPC: Top brands no longer simply bid on keywords but bid on “audience segments.” For example, targeting “fitness enthusiasts” personas with combined ads for protein powder, massage guns, and sports water bottles. Data shows this persona-based advertising architecture can reduce ACoS by 15-25% and increase revenue by 25-40%.
LTV Bidding Model: Advertisers now bid based on customer lifetime value (LTV) rather than single conversion value, meaning high-repurchase products (such as consumables, pet food) have higher bidding caps in advertising competition.
Chapter 3: Operating Cost Reconstruction and Refined Financial Models
In Amazon 2026, any product selection decision divorced from the latest fee structure calculation is blind gambling. Amazon transfers its logistics pressure to sellers through complex fee adjustments while also leaving profit space for refined operators.
3.1 Key Fee Changes in 2026
3.1.1 Inbound Placement Service Fee
This is the most impactful cost item in 2026. Amazon requires sellers to ship goods to multiple warehouses.
Minimal Split: Shipping to a single warehouse. Punitive Charge: Average $0.30 – $0.60/unit. For low-price products, this almost eats up all net profit.
Amazon Optimized: Shipping to 4+ warehouses. Fee: $0, but increases complexity and cost of first-leg logistics.
Countermeasure: When selecting products, evaluate packaging specifications and whether suitable for multi-point distribution. Or use third-party overseas warehouses (3PL) for transit, combined with Amazon’s AWD (Amazon Warehousing & Distribution) service.
3.1.2 Low-Inventory-Level Fee
When a product’s historical inventory level falls below 28 days of supply-demand coverage, Amazon will charge this fee.
Rate: Standard-size products approximately $0.32 – $1.11/unit.
Impact: This greatly penalizes “hunger marketing” or sellers with unstable supply chains.
Product Selection Insight: Must avoid products with long supply chains and uncontrollable production cycles. For highly seasonal products, inventory forecasting tolerance becomes extremely low.
3.1.3 Fulfillment Fees (FBA Fees) and Size Tiers
Base fulfillment fees increased an average of $0.08/unit, but structure is more segmented.
Low-Price FBA: Products priced below $10 enjoy an average $0.86/unit fulfillment fee discount. This preserves a lifeline for the “light and small goods” track, but only if volume is strictly controlled.
Large Bulky: New segmentation significantly increases logistics costs for large items, and they no longer enjoy partial discounts from SIPP (formerly SIOC) packaging certification.
3.2 2026 Scientific Product Selection Profit Calculation Formula
In 2026, calculating gross margin must incorporate the above variables. The traditional formula of Price – Purchase – Shipping – Commission – FBA has failed.
2026 Net Profit Model:
Net Profit = P – (Cogs + Tax) – Fref – Ffba – Finbound – Flow_inv – Cad – Cret
Where:
- P: Selling Price
- Cogs: Cost of Goods Sold including duties
- Tax: Tax compliance cost
- Fref: Referral Fee (typically 15%)
- Ffba: Fulfillment fee based on new size tiers
- Finbound: Inbound placement fee (budget $0.30 unless confirmed multi-warehouse)
- Flow_inv: Low inventory risk premium (suggest 5% reserve)
- Cad: Advertising cost (based on $1.00+ CPC and target ACoS)
- Cret: Return cost (including return processing fees and unsellable loss)
Chapter 4: Scientific Product Selection Methodology: From Red Ocean Breakthrough to Blue Ocean Construction
4.1 Avoiding “Red Ocean”: 2026 Negative List
Based on market saturation, compliance risks, and fee structure, the following categories belong to high-risk “red ocean” areas in 2026:
| Category | Risk Factors | 2026 Specific Challenges |
|---|---|---|
| Basic Consumer Electronics | Extreme commoditization, price wars | Shenzhen seller monopoly, De Minimis cancellation causes direct-shipping costs to soar, high return rates trigger A12 downranking. |
| Fast Fashion Apparel | High return rates, complex SKUs | Try-on-induced return processing fees and unsellable inventory extremely high; Shein/Temu low-price impact. |
| Generic Dietary Supplements | Strict regulation, high trust threshold | Requires FDA registration and COA certificates, Amazon extremely strict on efficacy claims (Restricted Products). |
| Fragile Items/Large Furniture | Uncontrollable logistics costs | Low SPI index, difficult distribution, high Inbound Placement fees. |
| Restricted Products | Policy risks | Laser pointers, pest control equipment, children’s toys with button batteries, etc., extremely cumbersome compliance documentation requirements. |
4.2 Locking “Blue Ocean”: High-Growth Niche Tracks
The core of blue ocean strategy is not finding non-existent categories but reconstructing existing category boundaries through value innovation.
4.2.1 Pet Tech & Care
The pet track remains strong, but opportunities lie in “consumption upgrading” and “solving specific pain points.”
Direction: Smart feeders (with cameras), bone health supplements for specific breeds, eco-friendly degradable pet toys.
Logic: High repurchase, high emotional premium, long LTV (lifetime value), suitable for LTV advertising bidding model.
4.2.2 Smart Home Micro-Upgrades
Consumers no longer frequently replace major appliances but tend toward “micro-upgrades.”
Direction: Smart curtain robots, under-cabinet sensor lights, water leak detection sensors.
Logic: Small volume (suitable for Low-Price FBA or standard items), easy installation, significantly improves quality of life.
4.2.3 Eco-Friendly & Sustainable
Aligned with Amazon Climate Pledge Friendly program.
Direction: Refillable cleaning products, zero-waste bathroom items, storage made from recycled materials.
Logic: Obtaining eco-badges provides additional traffic support, aligns with high-net-worth demographics’ values.
4.3 13-Point Scientific Product Selection Filter Funnel
At this stage, we introduce a strict 13-point quantitative standard. Any potential product must meet at least 11 items to be approved:
- Profit Margin Moat: Landed cost (including tariffs) < 30% of selling price.
- Price Sweet Spot: Price range $20 – $70 (covering rising customer acquisition costs).
- Real Demand: Main keyword monthly search volume > 10,000.
- Competitive Landscape: No single brand monopolizing >70% of first page.
- Differentiation Depth: At least 3 clear improvement points (pain point solutions).
- Seasonality: Year-round sales or at least 9 months peak season (avoid low inventory fees).
- Product Complexity: Simple structure, non-fragile, non-precision electronics (unless technical barrier).
- Return Risk: Similar competitor return rate below category average.
- Trend Validation: Google Trends 2-5 year trend steadily upward (not flash in pan).
- Brand Extensibility: Potential to build brand story through product line expansion.
- Supply Chain Resilience: High supplier cooperation, moderate MOQ.
- Compliance Safety: No patent infringement risk, complete certifications.
- Size Optimization: Strictly positioned in FBA standard size tiers, avoid oversized/overweight.
Chapter 5: Pangolinfo API-Empowered Data Intelligence System
In an era where the A12 algorithm updates every 15 minutes, manually scraping data through browser plugins can no longer meet “data velocity” requirements. Using Pangolinfo API to build automated market intelligence systems is the technical foundation for scientific product selection in 2026.
5.1 Why Choose API Automation?
Anti-Scraping Combat: Amazon’s defense mechanisms are extremely complex. Pangolinfo API has built-in global IP pools, automatic CAPTCHA solving, and browser fingerprint simulation, ensuring 99.9% collection success rate.
Data Fidelity: Unlike simple HTML parsing, Pangolinfo maintains complete page layout fidelity, capturing deep data such as “Coupon specific amounts,” “Variation inventory status,” etc.
Scalability: Supports millions of concurrent requests, which manual operations cannot achieve.
5.2 Core Data Collection and Analysis Practice
5.2.1 ASIN Deep Intelligence Collection (Product Detail API)
Through the amzProductDetail parser, we can obtain detailed competitor profiles for calculating the above SPI index and profitability.
API Call Example (Python):
import requests

url = "https://scrapeapi.pangolinfo.com/api/v1/scrape"
payload = {
    "url": "https://www.amazon.com/dp/B0DYTF8L2W",
    "formats": ["json"],
    "parserName": "amzProductDetail",
    "bizContext": {
        "zipcode": "10041"  # Key: Use NYC zipcode to simulate East Coast buyer perspective, detect inventory delivery timeliness
    }
}
headers = {
    "Authorization": "Bearer ",
    "Content-Type": "application/json"
}

response = requests.post(url, json=payload, headers=headers)
data = response.json()
Key Field Analysis and Decision Value:
shipping_details: Get “Prime delivery promise time.” If time > 2 days, indicates competitor may have insufficient distribution or inventory shortage—a good entry opportunity.
reviews_count & rating: Analyze review growth speed with timestamps to determine if artificial intervention (review manipulation) is occurring.
bought_together: Mine associated traffic for COSMO knowledge graph relevance analysis.
5.2.2 Search Results Page Macro Analysis (SERP API)
Use the amzKeyword parser to monitor keyword ranking dynamics.
Application Scenario: Input core keywords (e.g., “smart pet feeder”), scrape first 3 pages of data.
Analysis Dimension: Calculate ratio of organic vs. sponsored rankings. If first page ad ratio >30% and CPC bidding is high, indicates keyword has entered red ocean stage.
5.3 Automated Competitor Monitoring System Case: Clawdbot Workflow
This whitepaper specifically references a verified practical case: using Pangolinfo API combined with AI Agent (Clawdbot/Claude 3.5) to achieve fully automated monitoring, saving 25 hours of labor per month.
Workflow Architecture:
Data Layer: Node.js script calls Pangolinfo API daily on schedule, batch scraping 10 core competitor ASIN data.
Analysis Layer: Feed scraped JSON data to Claude 3.5 API.
Instruction Layer (Prompt): “As an e-commerce analyst, analyze the following data to find competitors experiencing ‘price drops,’ ‘low stock warnings,’ or ‘negative review surges’ today.”
Execution Layer: System automatically generates Markdown briefing pushed to Slack team channel.
Practical Results: System precisely captured a leading competitor’s stockout signal. Team immediately increased ad budget by 30% to capture traffic, gaining an additional $2,847 in sales within 48 hours.
Chapter 6: Cross-Platform Omni-Data Decision Model
Amazon on-site data reflects “stock competition,” while off-site data reflects “incremental trends.” Scientific product selection must look at Amazon from outside Amazon.
6.1 Google Trends Validation (via SERP API)
Use Pangolinfo’s universal search API interface to call Google Trends data.
Validation Logic: Before finalizing product selection, must check keyword Google search heat over past 3-5 years.
Data Indicators: Focus on interest_over_time. Ideal curve should be steadily rising or cyclically rising. Avoid “EKG” curves that suddenly spike vertically then quickly fall back (typical example: fidget spinners).
Geographic Analysis: Use geo parameter to segment U.S. state heat, assisting in judging ad placement geographic strategy.
6.2 Social Media Buzz Monitoring (Social Listening)
TikTok and Instagram are the sources of 2026 bestsellers.
API Application: Use Pangolinfo’s multi-platform collection capability to monitor video data under specific hashtags (e.g., #AmazonFinds, #TikTokMadeMeBuyIt).
Decision Model: If a product has high video views and high engagement rate (digg_count) on TikTok, but Amazon search volume has not yet exploded and supply count (Results Count) is low.
Conclusion: This is a perfect “blue ocean” opportunity. Leverage Amazon’s traffic lag, deploy in advance, wait for off-site traffic spillover.
Chapter 7: 30-Day Data-Driven Roadmap for New Product Launch
Based on the above analysis, we have formulated a standardized SOP for new product launch in 2026.
| Phase | Timeline | Key Actions | Data Support Tools |
|---|---|---|---|
| Validation | Day 1-7 | Competitor sales tracking: Establish first-page baseline sales (e.g., 20 orders/day). Compliance self-check: Prepare complete compliance documents (CPC, FDA, etc.). | Pangolinfo Data Pilot SellerCentral Compliance |
| Content | Day 8-14 | COSMO optimization: Ensure title and bullet points clearly relate to user scenarios (Context). Visual upgrade: Create high dwell-time A+ pages and videos. | AI Copywriting Tools Listing Quality Score |
| Launch | Day 15-21 | Vine program: Immediately register Vine to get first 30 reviews. Persona ads: Launch SP ads targeting specific audience segments. | Amazon Vine Amazon Ads Console |
| Explosion | Day 22-30 | Off-site traffic: Launch TikTok/Meta ads, use Amazon Attribution to track conversions. Inventory monitoring: Strictly prevent stockouts, avoid SPI index plunge. | Social Ads Manager Clawdbot Monitor |
Special Emphasis: During days 8-14, must embed keywords for A12 algorithm’s COSMO logic. Don’t just stuff “Running Shoes,” but write “Shock absorption for marathon training” to establish “scenario-function-product” knowledge graph links.
Conclusion
Amazon product selection in 2026 is a war about precision. From a macro perspective, rising compliance thresholds and complex fee structures have washed out numerous inefficient speculators. From a micro perspective, the combination of A12 algorithm and COSMO knowledge graph requires sellers to think like engineers—understanding how algorithms parse intent, understanding how inventory distribution affects ranking weights.
The value of technical tools like Pangolinfo API lies not in “scraping data” itself, but in empowering sellers with the ability to resonate with platform algorithms. Through API-enabled real-time monitoring, cross-platform data validation (Google/Social), and automated competitor analysis, sellers can transform uncertain “gambling” into high-probability “investment.”
In this new era, best practices can be condensed into one sentence: Use API speed to counter market changes, use knowledge graph depth to counter traffic involution, use financial model precision to counter cost increases. This is the ultimate answer to scientific product selection in 2026.
Disclaimer: This report is based on 2026 market forecasts and existing technical documentation. Amazon’s policies, fees, and API interface specifications may change over time. Readers are advised to conduct real-time verification before actual operations.
Visit Pangolinfo Console now to start your data-driven product selection journey. View complete API documentation for more technical details.

