
Amazon BSR Ranking Change Monitoring
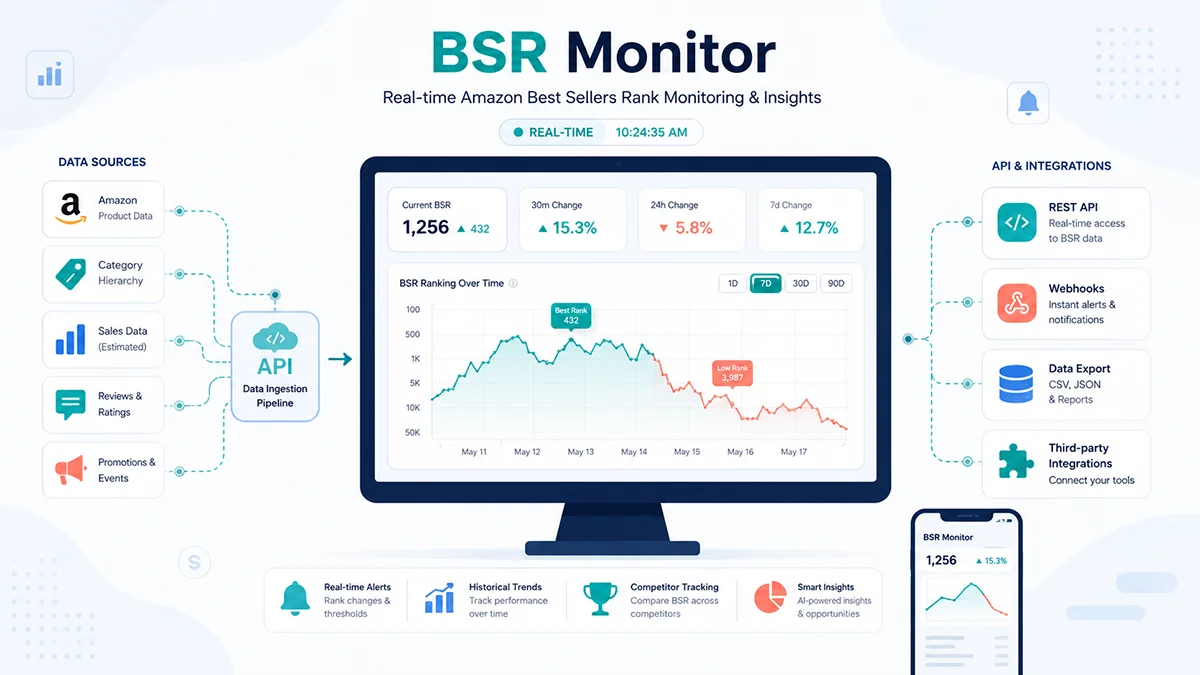
The real challenge of Amazon BSR ranking change monitoring isn’t seeing the BSR number. It’s capturing changes in real time, attributing them to concrete actions, and triggering automated responses. Keepa and SaaS tools lag 1-7 days. Self-built crawlers are a maintenance nightmare. SP-API doesn’t cover BSR rankings at all. The viable path is a real-time data API combined with MCP, collecting BSR at roughly 3-second latency while correlating it with price, ads, and inventory dimensions.
I’ve spent the last few years at Pangolinfo building Amazon data collection infrastructure, working with over a thousand seller teams across the US, Europe, and Asia. One scenario keeps repeating, and it became the reason I wanted to write this piece. A seller opens Keepa in the morning. Their product’s BSR climbed from 3,000 to 1,800 overnight. They celebrate for half the day, then dig in and discover a competitor went out of stock at 2 AM. By the time they react, the competitor has restocked. The window is gone. The BSR has already peaked and fallen back. Seeing the peak the next day makes the monitoring pointless.
Amazon BSR (Best Sellers Rank) refreshes every 1 to 2 hours based on recent sales velocity. It’s fundamentally a proxy metric for sales speed. Amazon doesn’t disclose actual unit sales for each ASIN, but BSR ranking changes reflect the relative ebb and flow of sales velocity among products within the same category. A product moving 20 units a day can see BSR swing 20% to 50% within a single day, and that’s completely normal. This means BSR isn’t a static metric you glance at once and move on. It’s a real-time pulse. You need continuous monitoring to extract meaningful signals from it.
But Keepa shows you a historical curve from a pre-stored database. Jungle Scout gives you a snapshot 3 to 7 days old. Helium 10 serves data 24 to 72 hours stale. Every day, you’re navigating with yesterday’s map. Real Amazon BSR ranking change monitoring should accomplish three things: see changes in real time, immediately understand why they happened, and be able to trigger automated responses. Every mainstream solution on the market has structural shortcomings in at least one of these areas.
Why Is BSR Ranking Change Monitoring So Hard?
Break BSR monitoring down and the difficulty concentrates in five areas. It’s not that any particular tool is poorly built. It’s that the inherent characteristics of BSR as a metric demand a specialized data infrastructure to monitor properly.
The first is the intra-day blind spot. BSR updates hourly, but most tools give you a single daily snapshot. If you check data at 9 AM, you have no idea what happened during the other 23 hours. During promotions this becomes critical. I worked with a home goods seller who bumped their coupon from 10% to 20% on Prime Day. BSR surged from 8,000 to 1,200 within two hours, then dropped back to around 7,000 as the coupon expired. When they checked Keepa the next morning, they saw a flat curve. The spike had been completely smoothed out by daily sampling. The seller misjudged the coupon’s effectiveness and used the same 10% coupon for the next promotion. Sales fell far short of expectations. Intra-day volatility isn’t noise. It’s the key signal for evaluating whether your operational actions are working.
The second is attribution difficulty. BSR drops from 5,000 to 2,000. The first question is always: why? Was it a price cut? A new ad campaign? A competitor going out of stock? Seasonal demand? But existing tools split BSR, price, ads, and inventory into separate modules, sometimes separate products entirely. You see the BSR curve on Keepa, ad data on Helium 10, inventory in Seller Central. The timestamps don’t even align. Keepa’s timestamp might be when it scraped the page. Helium 10’s might be when data entered its database. Seller Central’s might be when the order was created. Three timestamps off by hours makes attribution analysis completely unreliable. “BSR changed but I don’t know why” is fundamentally a data fragmentation problem compounded by timestamp misalignment. Good monitoring should put all dimensions under one timestamp, turning attribution into a simple diff operation.
The third is the scale ceiling on batch monitoring. A mature seller might need to track 200 to 500 competitor ASINs simultaneously. Add their own product lines and the monitoring list easily reaches a thousand. SaaS tools cap your daily queries. A mid-tier plan at a few hundred dollars a month often limits you to a few thousand queries per day. Keepa’s API has token quotas. A single batch call for 200 ASINs might exhaust your monthly allowance. Self-built crawlers buckle under anti-scraping defenses. Once monitoring scale goes up, cost and stability both become problems. Many sellers respond by “picking a few core competitors to monitor closely,” but the cost of that approach is missing most market signals. You think you have 5 direct competitors, but your subcategory might have 200 products competing for the same traffic pool.
The fourth is multi-marketplace comparison difficulty. The same ASIN has independent BSR calculations on Amazon US, DE, JP, and other marketplaces, because each marketplace has a different competitive pool. A brand seller operating across 5 marketplaces needs to compare the same product’s BSR performance across all of them. But most monitoring tools require separate subscriptions for each marketplace, and cross-marketplace data can’t be analyzed in a unified view. You see BSR dropping on US. Is the product’s competitiveness actually improving, or is it just the US competitive environment shifting? Without cross-marketplace comparison, you can’t tell.
The fifth is the interpretation gap between main category and subcategory BSR. Amazon BSR has two levels: main category rank (e.g., Electronics, with millions of competing products) and subcategory rank (e.g., Wireless Earbuds, with perhaps a few thousand competitors). Main category BSR has low volatility but weak signal. Subcategory BSR has high volatility but strong signal. Many sellers only watch main category BSR, thinking “today looks about the same as yesterday,” while their subcategory rank is swinging wildly. Good monitoring should capture both levels and dynamically adjust alert thresholds based on subcategory pool size. A 30% BSR change in a subcategory with only 500 products might be normal daily fluctuation. A 10% change in a category with 500,000 products deserves attention.
Five Common BSR Change Patterns: What Are You Actually Monitoring?
Before discussing solutions, let’s address a frequently overlooked question: BSR changes are not homogeneous. The same “BSR dropped” event can have completely different causes and require completely different responses. Having analyzed massive amounts of BSR change data at Pangolinfo, I’ve identified five common patterns. Understanding these patterns reveals where the real value of BSR monitoring lies.
Pattern one: promotion-driven. The most common and easiest to identify. A seller lowers price or increases coupon discount. Sales spike short-term, BSR surges. Characteristics: dramatic change (BSR can double within hours), short duration (BSR falls back after the promotion ends), and price and coupon fields change simultaneously. The value of monitoring this pattern is evaluating promotion effectiveness. You can see the elasticity coefficient of BSR to price adjustments, informing your next promotion’s pricing strategy.
Pattern two: ad-driven. A seller increases SP ad spend or adds new ad keywords. Ad-driven sales push up overall sales velocity, BSR rises. Characteristics: BSR increase accompanied by more ad placements or changed ad positions, while price and coupon remain unchanged. The value here is judging the BSR spillover effect of advertising. Ads don’t just bring direct sales. They boost BSR, which improves organic ranking, creating a positive feedback loop. Monitoring the correlation between ad placement changes and BSR changes is key to optimizing ad ROI.
Pattern three: competitor stockout. A direct competitor goes out of stock. Their sales spill over to your product, BSR rises. Characteristics: your BSR rises while the competitor’s BSR disappears or their stock status shows “out of stock,” and you made no operational changes yourself. The value is capturing overflow traffic. If you can detect a competitor stockout in real time, you can immediately increase ad spend to capture the spillover demand, rather than reacting after they restock.
Pattern four: seasonal fluctuation. Holidays, season changes, Prime Day, and other time-based events shift demand levels across an entire category. All products’ BSR fluctuate together. Characteristics: multiple ASINs in the category change BSR in the same direction, and the timing aligns with known events. The value is distinguishing “my product got better” from “the whole market got better.” If everyone’s BSR is rising, your BSR rising doesn’t necessarily mean your competitiveness improved.
Pattern five: algorithm adjustment. Amazon updates its A10 algorithm, changing BSR calculation weights or ranking rules. BSR shows anomalous fluctuations that don’t match sales velocity. Characteristics: multiple ASINs experience irregular BSR jumps simultaneously, with no corresponding operational actions or external events. This pattern is the hardest to identify and the most important to watch, because it may signal a fundamental shift in your organic traffic source.
These five patterns can only be identified through continuous, multi-dimensional monitoring. Daily snapshots miss the temporal characteristics of patterns one and two. Fragmented dimensions miss the correlation signals of patterns two and three. Single-marketplace monitoring misses the category-level dynamics of pattern four. This is why I keep saying BSR monitoring isn’t about “picking a tool.” It’s about “building a data infrastructure.”
What Are the Flaws in Current BSR Monitoring Solutions?
The market offers roughly four categories of BSR monitoring solutions. Each has structural flaws, not product bugs, but limitations baked into the technical approach or business model. Let me break them down one by one.
Keepa’s Limitations: Why the BSR History King Isn’t Enough
Keepa is the industry benchmark for BSR history tracking. No argument there. Its browser extension and price history charts are genuinely well-built, covering multiple Amazon marketplaces globally, with a functional free tier and a premium plan at about EUR 19/month. For “I want to see an ASIN’s BSR trend over the past few months,” Keepa is the best tool, period.
But the moment your needs graduate from “view one ASIN’s BSR history” to “batch-monitor BSR changes with automated alerts,” Keepa’s architecture starts straining. The core issue is that Keepa’s data architecture is a pre-stored database model. Its data flow works like this: Keepa’s crawlers scrape Amazon pages on their own schedule, storing BSR and price data in a historical database. When you query via the extension or API, you’re querying this database’s historical data points. What you see is a curve Keepa scraped and stored earlier, not the live BSR on Amazon’s page right now. Data freshness depends on Keepa’s crawl frequency, not your query frequency. Calling the API every minute doesn’t help. You get the same database snapshot.
On the API side, Keepa’s token mechanism is a hard constraint. Each API call consumes a certain number of tokens. When tokens run out, you need to top up. A single ASIN product query consumes about 1-2 tokens, while free accounts get only 100 tokens per month. Paid accounts have higher limits, but batch-monitoring 200 ASINs means a single full call burns 200-400 tokens, quickly hitting the ceiling. This means Keepa’s API is architecturally unsuited for batch real-time monitoring. It’s designed for low-frequency historical data queries.
On dimension coverage, Keepa stores only BSR and price. No coupon status, no inventory information, no SP ad placement distribution, no review data. Of the five BSR change patterns described earlier, Keepa can help you identify at most pattern four (seasonal fluctuation) and pattern five (algorithm adjustment), because it has no correlated dimensions for attribution. Ad-driven changes? You can’t tell it’s ads. Competitor stockout? You don’t know the competitor went out of stock.
As of May 2026, Keepa hasn’t shipped an MCP Server either. If you’re using AI Agents for operational automation, Agents can’t consume Keepa’s data directly. You’d need to manually export CSVs and feed them to the Agent, which doesn’t scale.
The Data Delay Trap in SaaS Tools
Helium 10, Jungle Scout, SellerSprite, and DataHawk all offer BSR monitoring as part of their suites, but data latency is the hard ceiling. According to exceptionalsellers.com’s April 2026 comparison, Jungle Scout’s BSR data refreshes every 3 to 7 days, with 24 to 48 hours for hot categories at best. Helium 10 sits at 24 to 72 hours, even on the most expensive plans. SellerSprite is somewhat faster with daily updates but still carries similar delays. DataHawk claims daily updates but experiences multi-hour delays during peak periods.
The delay stems from these tools’ data processing pipelines. Take Jungle Scout: its data flow runs from backend crawlers batch-collecting Amazon page data, into a central database, through cleaning and metric calculation, then pushed to user dashboards. Each step eats time. The collection layer has scheduling delays (not every ASIN is scraped every hour). The storage layer has ingestion delays. The cleaning layer has batch processing delays. The display layer has cache refresh delays. Stack these together and the BSR data you see is 1 to 7 days older than reality.
More fundamentally, these tools’ databases are their core commercial asset. Architecturally, they cannot give you raw data access. You see only their predefined fields. Want to customize your analysis dimensions? Not an option. For example, if you want to see “did SP ad placements change when BSR changed,” most SaaS tools don’t even provide ad placement data. Even those that do keep it in a separate module with timestamps that don’t align with BSR data.
Query limits are equally tight. A mid-tier plan at a few hundred dollars a month might cap you at a few thousand queries daily. Monitoring 200 ASINs at 4-hour intervals means 1,200 queries per day. Add other feature usage and you easily hit the ceiling. Want more queries? Upgrade. Monthly fee doubles. The relationship between monitoring scale and cost is linear, sometimes super-linear.
There’s also an easily overlooked issue: SaaS tools decide their own data collection coverage. Which ASINs they scrape, how often, which fields, are all product-level decisions. If your competitor isn’t in their collection list, or your subcategory is niche with low update frequency, your data is even staler. You pay the subscription but have zero control over your own data supply chain.
The Maintenance Hell of Self-Built Crawlers
Some technically capable teams roll their own Scrapy or Selenium scripts to collect BSR. Early on, it feels great. You collect exactly the fields you want, at the frequency you control. This approach is reasonable for prototyping. But once you enter long-term production, Amazon’s anti-scraping system will give you a deep understanding of “maintenance hell.”
Amazon’s anti-scraping is multi-layered and dynamically upgraded. Layer one: User-Agent detection. You need a real device fingerprint library for rotation. Layer two: TLS fingerprinting. Standard requests or Scrapy TLS fingerprints differ from real browsers and get flagged as bots. You need curl_curl or custom browser fingerprint simulation. Layer three: rate limiting. Too many requests from one IP in a short window triggers throttling or bans. You need a globally distributed proxy IP pool with residential and datacenter IPs, intelligently routed by target marketplace. Layer four: CAPTCHA challenges. When triggered, you need AI image recognition plus human solving, with 99%+ success rates costing real money. Layer five: dynamic JavaScript rendering. Much page content loads via JS. You need Headless Chrome or Firefox for full simulation, which is far heavier than simple HTTP requests. Layer six: page structure changes. Amazon periodically adjusts page DOM structure. Your parsing rules work today and fail to extract BSR tomorrow.
At Pangolinfo I’ve watched teams go down this path repeatedly. First two months, full of optimism. Crawler works, data flows, feels like saving API costs. Third month, firefighting begins. IPs banned, CAPTCHAs appearing, parsing broken. Sixth month, maintenance costs exceed what they’d pay for an API. I helped one team calculate their costs: proxy IP pool (residential plus datacenter mix) about $300/month, server cluster running Headless Browsers about $200/month, CAPTCHA solving service about $150/month, 0.5 FTE engineer maintenance about $800/month. Total: roughly $1,450/month. They were monitoring 150 ASINs. The same scale via real-time API would cost under $40/month.
The more insidious cost is data quality instability. Crawlers occasionally collect null values, parse incorrectly, or miss data due to IP throttling. These issues are hard to detect at the consumption end. You think BSR hasn’t changed, but actually the collection failed. Silent errors are more dangerous than visible crashes, because they lead you to make operational decisions on incorrect data.
Why SP-API Doesn’t Cover BSR Rankings
Amazon SP-API is the official interface, so it should be the most reliable option. Many sellers’ first reaction is “since there’s an official API, why use a third-party scraping service?” The problem is that SP-API’s design goals and BSR monitoring needs are fundamentally mismatched.
SP-API is positioned as a seller backend data exchange interface. It provides: order management (Orders API), advertising reports (Advertising API), FBA inventory (FBA Inventory API), catalog items (Catalog API), pricing (Pricing API), and more. What these data sources have in common: they’re all from your own seller backend. You can query your own store’s orders, ad spend, and inventory levels through SP-API.
But BSR rankings, Best Sellers lists, new releases, reviews, and ad placement distribution are Amazon frontend public data. SP-API doesn’t cover any of them. Want to monitor a competitor’s BSR? SP-API can’t help, because the competitor’s BSR isn’t in your seller backend. Want to see ad placement distribution for a keyword search results page? SP-API doesn’t have that endpoint either. SP-API’s Catalog API can return basic product info (title, brand, category) but not BSR ranking values.
The barrier to entry is also non-trivial. SP-API registration approval takes 3 to 7 days, requires a Professional seller account and developer registration. After approval, there are quota limits with different rate limits per endpoint, some allowing only a few hundred calls per hour. Engineering integration costs are significant, requiring OAuth authentication, token refresh, and signature verification. For “monitor BSR changes” as a requirement, SP-API is fundamentally the wrong tool. It solves problems on a different level than what you need.
Real-Time BSR Monitoring vs Legacy Tools: How Wide Is the Gap?
Put all four approaches side by side and the gap becomes obvious. The table below compares six dimensions, each directly corresponding to an operational pain point.
| Dimension | Keepa | SaaS Tools | Self-Built | SP-API | Real-Time API (Pangolinfo) |
|---|---|---|---|---|---|
| Data latency | Hours (cached) | 24h-7 days | Depends on frequency | Real-time (backend only) | ~3 seconds |
| BSR ranking coverage | Partial | Partial | Can cover | Not covered | Full (main + subcategory) |
| Batch scale | Token-limited | Query-limited | Anti-scraping-limited | Quota-limited | 30M+/day |
| Dimension correlation | BSR + price only | Predefined fields | Customizable | Backend data only | BSR+price+ads+stock+coupon |
| Agent integration | None | None | DIY | None | MCP, 19 tools |
| Monthly cost (200 ASINs) | ~EUR 19 | $200-400 | $200-2,000 | Free (high eng.) | $20-50 |
Data latency shows the most dramatic gap and most directly impacts decision quality. Keepa hands you data from hours ago. SaaS tools serve snapshots 1 to 7 days old. A real-time API gives you the actual BSR currently displayed on Amazon’s page. Given that BSR refreshes hourly, this gap determines whether you can see intra-day volatility or only daily averages. Of the five BSR change patterns described earlier, promotion-driven and ad-driven patterns have temporal characteristics at the hourly level. Daily snapshots simply can’t capture them.
Dimension correlation matters just as much. Legacy approaches give you either BSR and price alone (Keepa), predefined fields you can’t extend (SaaS tools), or require painful manual correlation (self-built). A real-time API returns BSR, price, coupon status, inventory level, and SP ad placement distribution in a single call, all sharing one timestamp. Attribution analysis can be done directly. No cross-tool data stitching, no timestamp alignment. The competitor stockout pattern requires seeing both your BSR rise and the competitor’s stock flip to “out of stock” simultaneously. In dimensionally fragmented tools, that means cross-platform viewing. In a real-time API, one call returns all dimensions.
Agent integration is a new dimension for 2026 and increasingly important. As of May 2026, Keepa, Helium 10, and Jungle Scout have not shipped MCP Servers. If you’re building AI Agent workflows for operational automation, you can’t access their data. The real-time API approach provides 19 tools via the MCP protocol, callable by Agents using natural language.
On cost, monitoring 200 ASINs at 4-hour intervals means roughly 1,200 calls per day. SaaS tool combos run $200 to $400 monthly. Self-built crawlers cost $200 to $2,000 monthly, not counting engineering hours. The real-time API approach lands at $20 to $50 monthly. Total cost of ownership drops 50% to 70%. Factor in hidden costs (unstable data quality, maintenance hours, opportunity cost of missed windows) and the real-time API advantage grows further.
How Pangolinfo Implements Real-Time BSR Ranking Change Monitoring
When we built the BSR monitoring solution at Pangolinfo, we set one principle: don’t treat BSR as an isolated number. Treat it as a node in the full operational decision context. When BSR changes, you should immediately see whether price moved, whether ad placements shifted, whether a competitor went out of stock. Around that principle, the solution has four layers, each addressing a specific legacy tool pain point.
Real-Time Layer: ~3-Second Latency for Main and Subcategory BSR
This is the foundation. Every call to the Amazon Scraper API triggers a real-time request to Amazon, collecting the current BSR values displayed on the page. Not a historical snapshot pulled from a database. The live number, right now. After the request fires, the system routes through a distributed proxy layer to select the optimal IP, a dynamic rendering engine processes JavaScript content, and a parsing matrix extracts structured fields. The median end-to-end latency is about 3 seconds.
In Pangolinfo’s production environment, this latency is measured at 30M+ daily call volume, not a lab ideal. Success rate holds at 99%, meaning roughly 1 in 100 calls might fail. With exponential backoff retry, effective availability reaches 99.9%+.
This performance means you can push collection frequency to hourly or higher. Two hundred ASINs collected every hour, 4,800 calls a day, no strain. Five hundred ASINs every 2 hours, 6,000 calls daily, equally manageable. Intra-day volatility is no longer a blind spot. The promotion-driven and ad-driven patterns described earlier become visible at hourly resolution.
The collected BSR data includes both main category and subcategory rankings. This matters. Main category BSR suits long-term brand health monitoring. Subcategory BSR suits short-term competitive analysis. Good monitoring captures both and dynamically adjusts alert thresholds based on subcategory pool size.
Structural Layer: JSON Output Correlating BSR with Price, Ads, and Inventory
A single API call returns structured JSON where BSR is just one field. The same response includes current price, coupon status and discount, inventory state, SP ad placement distribution (including ad position and corresponding keywords), review count, and rating. All fields share the same timestamp, aligned by design.
The value here shows up most clearly in attribution analysis. BSR drops from 5,000 to 2,000. Pull up the JSON from this call and the previous one, do a field-level diff, and you immediately see: price dropped 15%, coupon went from 10% to 20%, SP ad placements increased from 2 to 5, with 3 new top-of-search positions. Attribution doesn’t require cross-tool data assembly or timestamp alignment. One comparison does it.
The SP ad placement collection rate deserves special mention. In Pangolinfo’s testing, we achieved a 98% SP ad placement collection rate, currently the highest in the industry. Amazon’s SP ad placements are dynamically displayed. Different times, different zip codes, different search terms can show different ad placements. Collection is technically demanding. A 98% rate means you’ll almost never miss an ad placement change. When ad placement data correlates with BSR, you can tell whether a BSR increase is ad-driven (more ad placements and BSR up) or organic (ad placements unchanged but BSR up). This distinction is critical for ad ROI optimization. If BSR rose from ads, you need to evaluate ad return on investment. If it rose organically, your Listing optimization or review accumulation is paying off.
Another dimension worth mentioning is zip-code-specific collection. Amazon’s search results and ad placements are geographically localized. The same keyword can show different ad placements and different BSR in Los Angeles (zip 90001) versus New York (zip 10001). Pangolinfo supports specified zip code collection, letting you see the real competitive landscape across regions. This is especially useful for sellers running region-specific ad strategies.
Scale Layer: 30M+/Day Batch Concurrent Monitoring
Monitoring 200 ASINs is entry-level. Brand sellers may need to track thousands of ASINs across multiple marketplaces. A brand doing $10M+ in annual revenue might have 300 of its own ASINs plus 700 competitor ASINs to monitor, spread across 5 marketplaces, totaling 5,000 monitoring targets. At 4-hour intervals, that’s 30,000 calls per day. This scale is nearly unimaginable for SaaS tools and catastrophic for self-built crawlers.
Pangolinfo’s distributed collection engine supports 30M+ daily concurrent calls, covering 21+ Amazon marketplaces. Whether you monitor 200 or 2,000 ASINs, the system holds steady. Concurrent collection via ThreadPoolExecutor or asyncio means 200 ASINs can be collected within 1 minute, without serial wait times stretching overall latency.
Cost-wise, it’s pay-per-use. No paying for features you don’t use. During product research phases you might call a few hundred times a month. During routine monitoring you control frequency precisely. Total cost can drop to 30% or less of a self-built crawler. For 200 ASINs at 4-hour intervals, monthly cost runs $20 to $50. The same scale on SaaS tools costs $200 to $400. Self-built crawlers run $700 to $2,000.
Agent Layer: MCP, API, and Skill, Three Integration Forms
In 2026, more teams are adopting AI Agents for operational automation. This is an irreversible trend. But as of May 2026, Keepa, Helium 10, and Jungle Scout have not shipped MCP Servers. Agents can’t access their data. If you want to build a workflow where “an Agent automatically monitors BSR changes and triggers responses,” legacy tools can’t participate.
Pangolinfo offers three integration forms covering different use cases and technical capabilities. The Amazon Data MCP includes 19 tools, runs over remote HTTP with zero installation. Once configured, an Agent can invoke BSR collection using natural language. The REST API serves teams with development capability for deep integration into existing systems, supporting custom scheduling, storage, and alerting logic. The Amazon Scraper Skill targets Agent workflows, install and use, ideal for quickly building monitoring flows on Agent platforms.
For example, tell your Agent: “Monitor these 50 ASINs’ BSR. Notify me if any drop more than 20%, and tell me whether price and ad placements changed.” The Agent receives the instruction, automatically calls the MCP’s BSR collection tool to fire batch requests, compares results with previous data, detects threshold-exceeding changes, pulls price and ad placement fields for attribution analysis, and pushes the alert with attribution results to your designated channel. The entire flow requires no code. This is unimaginable under Keepa or Helium 10’s architecture. Their databases are closed. Agents can’t get in.
How to Build a BSR Change Monitoring System with the API
The Python code below demonstrates a complete BSR change monitoring system using the Pangolinfo Scraper API: concurrent batch collection of BSR and correlated dimensions, SQLite storage for historical data, field-level diff for attribution analysis, and threshold-based alerting.
import requests
import json
import sqlite3
from datetime import datetime
from concurrent.futures import ThreadPoolExecutor, as_completed

API_ENDPOINT = "https://api.pangolinfo.com/v1/amazon/product"
API_KEY = "YOUR_API_KEY"
DB_PATH = "bsr_monitor.db"
ALERT_THRESHOLD = 0.2  # 20% BSR change threshold

def init_db():
    """Initialize SQLite database"""
    conn = sqlite3.connect(DB_PATH)
    conn.execute("""
        CREATE TABLE IF NOT EXISTS bsr_history (
            id INTEGER PRIMARY KEY AUTOINCREMENT,
            asin TEXT NOT NULL,
            bsr_main INTEGER,
            bsr_sub TEXT,
            price REAL,
            coupon TEXT,
            stock TEXT,
            ads_count INTEGER,
            ads_detail TEXT,
            timestamp TEXT NOT NULL
        )
    """)
    conn.execute("CREATE INDEX IF NOT EXISTS idx_asin_ts ON bsr_history(asin, timestamp)")
    conn.commit()
    conn.close()

def fetch_single(asin, country="US"):
    """Fetch BSR and correlated dimensions for a single ASIN"""
    try:
        resp = requests.get(
            f"{API_ENDPOINT}/{asin}",
            headers={"Authorization": f"Bearer {API_KEY}"},
            params={"country": country, "fields": "bsr,price,coupon,stock,ads"},
            timeout=10
        )
        data = resp.json()
        ads = data.get("ads", [])
        return {
            "asin": asin,
            "bsr_main": data.get("bsr", {}).get("main"),
            "bsr_sub": json.dumps(data.get("bsr", {}).get("subcategory", [])),
            "price": data.get("price"),
            "coupon": json.dumps(data.get("coupon")),
            "stock": data.get("stock"),
            "ads_count": len(ads),
            "ads_detail": json.dumps(ads),
            "timestamp": datetime.now().isoformat()
        }
    except Exception as e:
        print(f"[ERROR] ASIN {asin} failed: {e}")
        return None

def fetch_bsr_batch(asin_list, country="US", max_workers=10):
    """Concurrent batch collection, 200 ASINs in about 1 minute"""
    results = []
    with ThreadPoolExecutor(max_workers=max_workers) as executor:
        futures = {executor.submit(fetch_single, asin, country): asin for asin in asin_list}
        for future in as_completed(futures):
            result = future.result()
            if result:
                results.append(result)
    return results

def save_to_db(records):
    """Batch store collection results"""
    conn = sqlite3.connect(DB_PATH)
    for r in records:
        conn.execute("""
            INSERT INTO bsr_history (asin, bsr_main, bsr_sub, price, coupon, stock, ads_count, ads_detail, timestamp)
            VALUES (?,?,?,?,?,?,?,?,?)
        """, (r["asin"], r["bsr_main"], r["bsr_sub"], r["price"],
              r["coupon"], r["stock"], r["ads_count"], r["ads_detail"], r["timestamp"]))
    conn.commit()
    conn.close()

def get_last_snapshot(asin_list):
    """Get the most recent snapshot for each ASIN"""
    conn = sqlite3.connect(DB_PATH)
    snapshot = {}
    for asin in asin_list:
        cursor = conn.execute(
            "SELECT * FROM bsr_history WHERE asin=? ORDER BY timestamp DESC LIMIT 1", (asin,))
        row = cursor.fetchone()
        if row:
            snapshot[asin] = {"bsr_main": row[2], "price": row[4],
                              "coupon": row[5], "ads_count": row[7]}
    conn.close()
    return snapshot

def detect_and_attribute(current_list, previous_map, threshold=0.2):
    """Detect BSR changes with field-level attribution"""
    alerts = []
    for curr in current_list:
        asin = curr["asin"]
        prev = previous_map.get(asin)
        if not prev or not prev["bsr_main"] or not curr["bsr_main"]:
            continue
        change_ratio = (prev["bsr_main"] - curr["bsr_main"]) / prev["bsr_main"]
        if abs(change_ratio) < threshold:
            continue
        # Field-level attribution
        attribution = []
        if prev["price"] != curr["price"]:
            attribution.append(f"Price: {prev['price']} -> {curr['price']}")
        if prev["coupon"] != curr["coupon"]:
            attribution.append("Coupon status changed")
        if prev["ads_count"] != curr["ads_count"]:
            attribution.append(f"Ad placements: {prev['ads_count']} -> {curr['ads_count']}")
        if not attribution:
            attribution.append("No correlated change detected, possible competitor stockout/seasonal/algorithm shift")
        alerts.append({
            "asin": asin, "prev_bsr": prev["bsr_main"], "curr_bsr": curr["bsr_main"],
            "change": f"{change_ratio*100:.1f}%", "attribution": attribution,
            "timestamp": curr["timestamp"]
        })
    return alerts

# === Usage ===
if __name__ == "__main__":
    init_db()
    asin_list = ["B09G9FPHY6", "B08N5WRWNW", "B0CHX1W1QT"]

    # 1. Concurrently fetch current BSR and all dimensions
    current = fetch_bsr_batch(asin_list)

    # 2. Get previous snapshot
    previous = get_last_snapshot(asin_list)

    # 3. Detect changes and attribute
    alerts = detect_and_attribute(current, previous, ALERT_THRESHOLD)
    for a in alerts:
        print(f"[ALERT] {a['asin']} BSR {a['prev_bsr']}->{a['curr_bsr']} ({a['change']})")
        for attr in a["attribution"]:
            print(f"  - {attr}")

    # 4. Store current results
    save_to_db(current)

    # 5. Pair with APScheduler for continuous monitoring
    # from apscheduler.schedulers.blocking import BlockingScheduler
    # scheduler = BlockingScheduler()
    # scheduler.add_job(monitor_job, "interval", hours=4)
    # scheduler.start()
The core logic has five steps: concurrently collect current BSR and all dimensions, retrieve the previous snapshot, perform field-level diff for attribution, output alerts, and store current results. Paired with APScheduler or cron, it enables continuous monitoring. The attribution logic is the key. It doesn’t just tell you “BSR changed.” It tells you “BSR changed, and price/coupon/ad placements also changed,” immediately revealing the most likely cause.
If you integrate via MCP with an Agent, you don’t even need this code. A natural language instruction like “Monitor these 50 ASINs’ BSR, alert me if any drop more than 20%, and tell me if price and ad placements changed” lets the Agent orchestrate collection, comparison, attribution, and alerting automatically.
For category-level BSR ranking monitoring, combine with the Amazon Niche Data API to pull category trees and Best Sellers list data, extending coverage from individual ASINs to entire categories. If you want to monitor the BSR trends of the Top 100 products in the Wireless Earbuds subcategory, Niche Data API fetches the list ASINs while Scraper API collects each ASIN’s BSR and correlated dimensions. Together, they form a complete category-level monitoring system.
How to Design Monitoring Frequency and Alert Thresholds
Once the system is running, two parameters need tuning based on your business context: collection frequency and alert thresholds.
For collection frequency, I recommend tiering by ASIN importance. Core competitor ASINs (top 10 ranking for the same search terms) should be collected hourly to capture all intra-day volatility. Secondary competitor ASINs (subcategory top 50 but not direct competitors) every 4 hours. Long-tail monitoring ASINs (subcategory top 200 periphery) daily. This tiered design controls cost while ensuring sufficient data density for core targets. Of 200 ASINs, if 30 core ones are collected hourly, 70 secondary every 4 hours, and 100 long-tail daily, total daily calls run about 1,300, costing roughly $20 to $30 monthly.
For alert thresholds, uniform thresholds don’t work. Main category BSR’s normal fluctuation range differs entirely from subcategory BSR. I recommend dynamically adjusting based on subcategory pool size: categories with 100,000+ products, alert at 10% BSR change. Categories with 10,000 to 100,000, alert at 15%. Categories with 1,000 to 10,000, alert at 25%. Categories under 1,000, alert at 35%. This prevents frequent false alarms in small subcategories while ensuring significant changes in large categories don’t go unnoticed.
A practical tip: add a duration filter. BSR fluctuating 30% over 2 hours then reverting is a different signal from BSR dropping 30% consistently over 3 days. The former might be intra-day noise or a short promotion. The latter likely signals a real competitive shift. Adding a “trigger alert only after N consecutive collections exceed threshold” condition dramatically reduces false positives.
Frequently Asked Questions
Can Keepa monitor BSR ranking changes?
Keepa can display BSR historical trend charts, but its data comes from a pre-stored database, not real-time collection. The API has token quota limits, cannot batch-monitor large ASIN lists, and offers no MCP or Agent integration. For viewing a single ASIN’s historical trends, Keepa works fine. For batch real-time monitoring with alerts, it falls short.
How often does Amazon BSR update?
Amazon BSR refreshes every 1-2 hours based on recent sales velocity. For products selling 10+ units per day, intra-day BSR fluctuations of 20-50% are normal. But most monitoring tools only provide daily snapshots, meaning you miss 12-24 data points each day.
How many API calls does BSR monitoring require?
Monitoring 200 ASINs at 4-hour intervals requires about 1,200 calls per day. A single Pangolinfo API call returns BSR along with price, coupon, stock, and ad placement data, so no duplicate requests are needed. With 30M+/day capacity and 99% success rate, this scale is well within capability.
Can SP-API collect BSR ranking data?
No. Amazon SP-API only provides seller backend data (orders, ads, FBA inventory). It does not cover BSR rankings, Best Sellers lists, new releases, reviews, or ad placement data from the frontend. SP-API also requires 3-7 days for approval and has high engineering overhead. To collect BSR rankings, page scraping is the only viable route.
How do I monitor BSR changes with an AI Agent?
Through Amazon Data MCP (19 tools, remote HTTP with zero installation), an AI Agent can invoke BSR collection capabilities using natural language. For example, tell your Agent: “Monitor these 50 ASINs’ BSR and notify me if any drop more than 20%.” The Agent handles collection, comparison, and alerting automatically, with no code required.
Summary and Next Steps
Back to the original question: how should you approach Amazon BSR ranking change monitoring? The answer is clear. BSR is an hourly-updating proxy metric for sales velocity. Its value lies in change trends, not absolute values. Legacy solutions have structural shortcomings in real-time performance, dimension correlation, scale, and Agent integration that can’t be fixed by upgrading tools. Keepa’s pre-stored database architecture can’t meet real-time needs. SaaS tools’ closed database architecture eliminates dimension correlation. Self-built crawlers’ maintenance costs grow exponentially over time. SP-API architecturally doesn’t cover BSR ranking data.
Treating BSR monitoring as a real-time data infrastructure problem, using real-time API collection with MCP integration, is currently the only approach that simultaneously delivers hourly latency, full-dimension correlation, batch scale, and Agent friendliness. The real-time layer ensures you see current BSR, not historical snapshots. The structural layer ensures attribution analysis needs only one diff, not cross-tool data assembly. The scale layer ensures monitoring 2,000 ASINs is as stable as monitoring 200. The Agent layer ensures AI Agents can drive the entire monitoring workflow via natural language.
If you’re evaluating BSR monitoring solutions, I suggest validating from two directions. First, take 20 core ASINs and run hourly collection, comparing data latency and dimension coverage against your current tools. You’ll find the gap is larger than expected, not 10% or 20% but a fundamental difference between “seeing intra-day volatility” and “seeing daily averages.” Second, configure an MCP integration with an Agent and run a monitoring-and-alerting flow in natural language. You’ll find Agent-driven monitoring workflows are an order of magnitude more efficient than manually checking tools. Once both work, you’ll know exactly where the gap is.
Want to experience real-time BSR ranking change monitoring? Try Pangolinfo Amazon Scraper API now, or learn how Amazon Data MCP lets AI Agents integrate BSR monitoring with zero code.Check the API documentation
Author: Leo, Technical Lead / Chief Architect at Pangolinfo. Focused on Amazon e-commerce data collection and API architecture, processing 30M+ daily data requests. This article is based on the Pangolinfo team’s production data and engineering practices in BSR monitoring scenarios.
Published: 2026-07-07 | Updated: 2026-07-08