

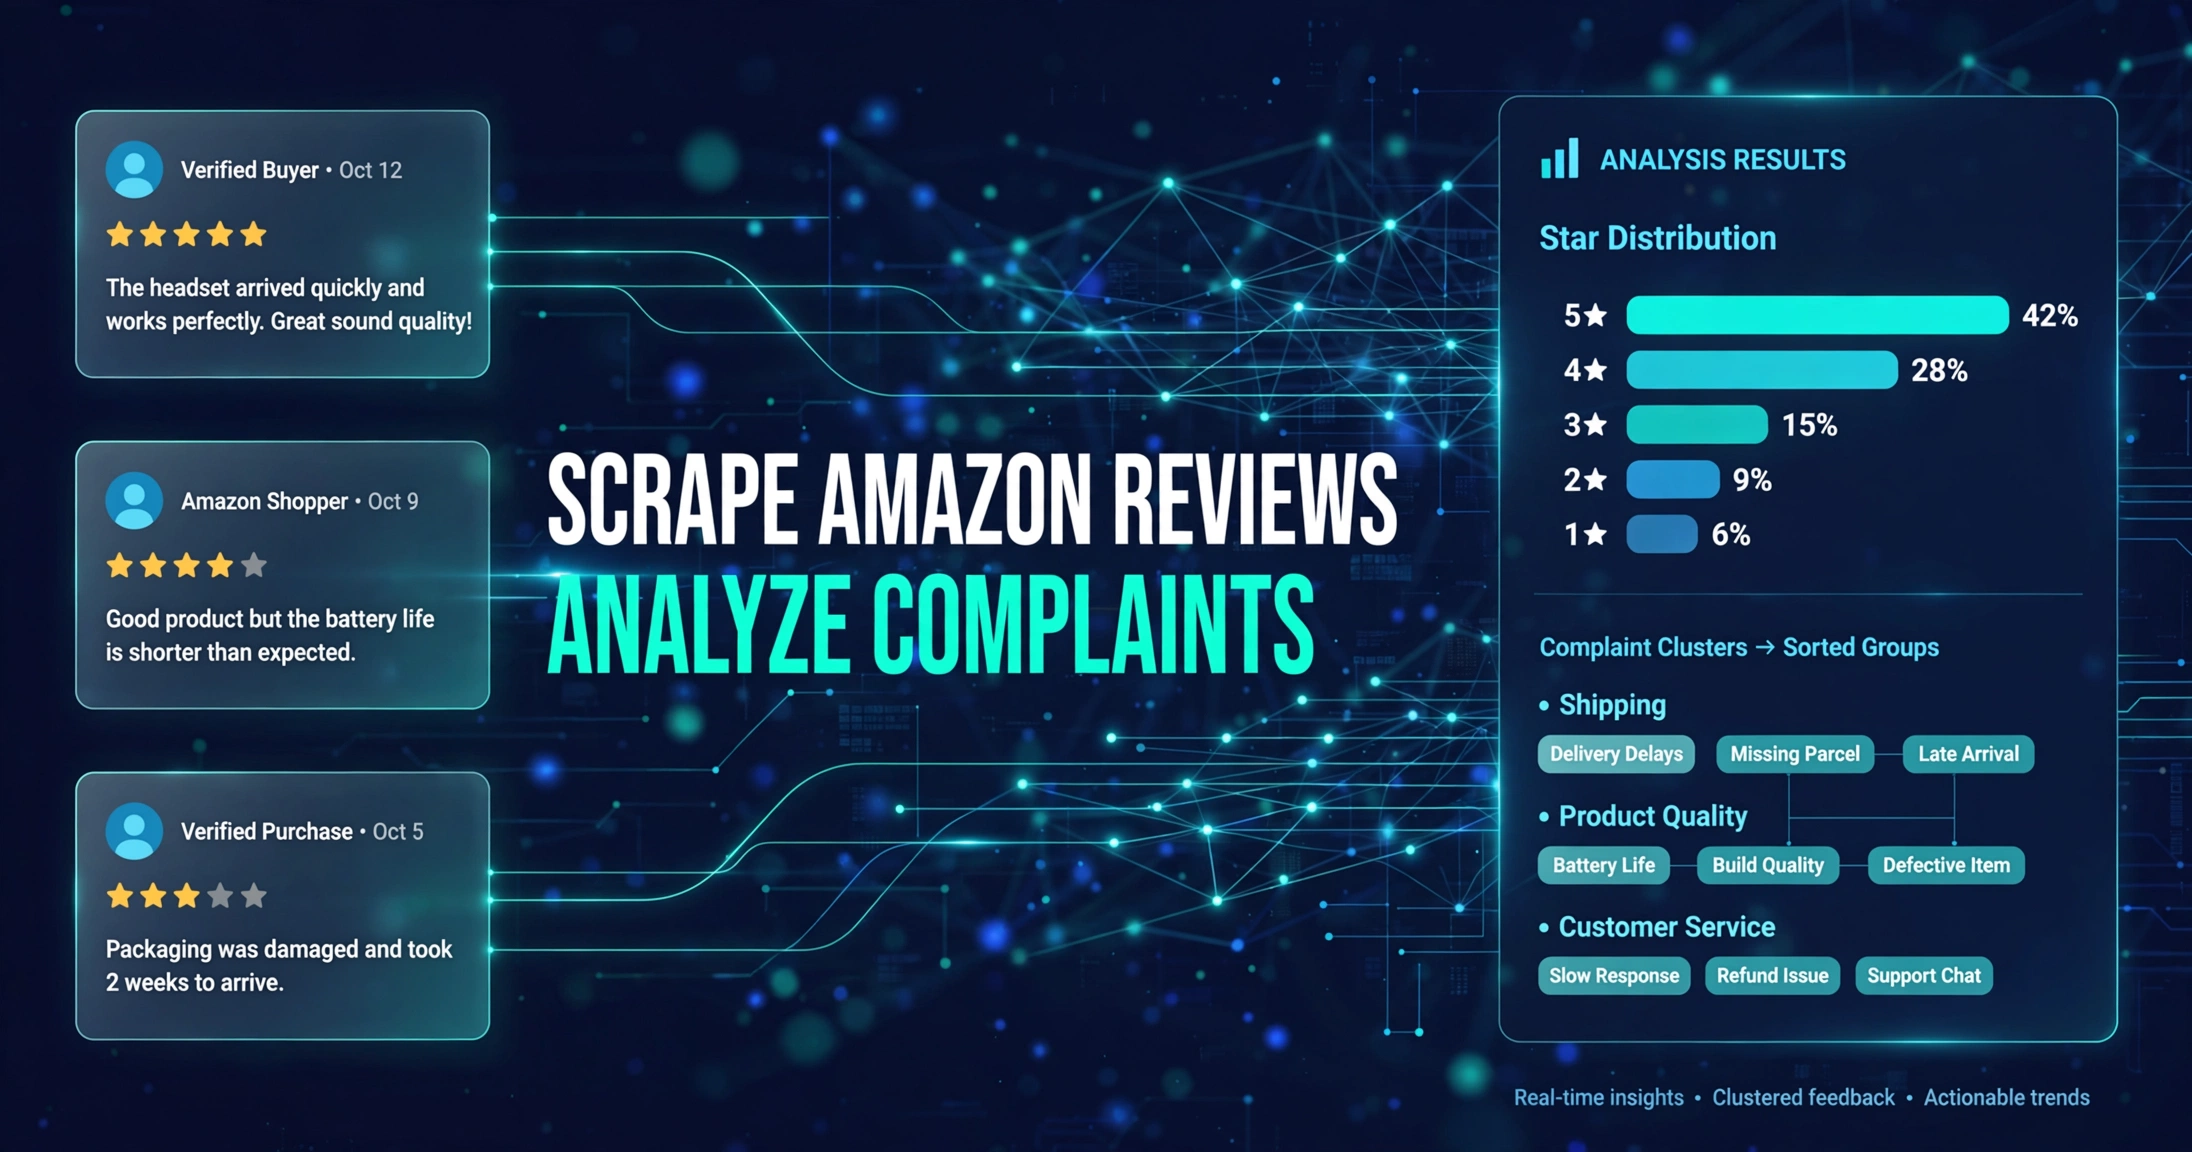
In the data map laid out in this series’ pillar guide, reviews and Q&A occupy a category of their own, for one structural reason: price, rank, and review counts describe what happened in the market — they are outcome variables. Review text describes why buyers are unhappy — it is one of the few raw materials that points directly at causes. That is why review data has the highest value density of any category, and also why the most common ways of using it contain a systematic error: reading the average rating, or reading the handful of reviews the product page shows by default, and drawing conclusions from either.
This article sets out a complete methodology, in a strict order that should not be rearranged. Step one: pull the complete review corpus for an ASIN, not a sample. Step two: compute the star distribution before looking at the average. Step three: cut the critical subset — the 1–3 star reviews — and cluster it into complaint themes. Step four: translate the theme clusters into concrete product and Listing actions. The order matters because each step supplies the next one’s denominator: without the full corpus, the distribution is an estimate; without the distribution, the critical subset has no base; without clustering, corrective actions have no priorities. This is one of the C-group articles in the series, each devoted to a single data type. The bulk collection of structured product fields — titles, prices, variants, category placement — is a separate task, covered by its companion piece, C1, How to Scrape Amazon Product Data in Bulk. Reviews answer “what are buyers complaining about”; product data answers “what is the market selling”. A complete competitor picture needs both corpora.
1. First, correct a premise: the average rating systematically hides the distribution
An average rating treats an ordinal scale (1 to 5 stars) as if it were an interval measurement and collapses it into a mean. Its first defect is that the same average can describe opposite shapes. Imagine two products, both rated 4.3. Product A’s reviews are concentrated at 4 and 5 stars, with a thin tail of 1-star reviews: the product broadly meets expectations and dissatisfaction is incidental. Product B’s reviews are bimodal: a majority of 5-star reviews alongside a substantial block of 1-star reviews — the product works very well for one group of buyers and fails systematically for another. The correct responses are entirely different. Product A needs incremental improvement. Product B needs someone to find the failure scenario its 1-star reviewers share. The average compresses both shapes into the same number, and the information the decision actually needs is destroyed in the compression.
The second defect is that the storefront display is not a random sample. The reviews shown by default on a product page are ranked by the platform — typically “top reviews” first, ordered by helpfulness votes. That ranking reflects other readers’ voting behaviour and has no relationship to the distribution of the full corpus. Concluding “buyers mainly complain about X” from the first two pages of displayed reviews means generalising from a subset filtered by a ranking algorithm and a voting process — a biased sample presented as a statistic.
The third defect is temporal. The displayed average is a cumulative mean over the product’s entire commercial lifetime. A redesign, a supplier change, or a single defective production batch is diluted by years of accumulated history until it becomes nearly invisible. Yet the operationally relevant question is almost always about the present: is the product buyers receive now good? A lifetime average is structurally late to that question. This is why the methodology insists on a dated corpus: only a distribution carrying a time dimension can separate the current product from its history.
The first conclusion of this methodology follows: the legitimate starting point of review analysis is the star distribution computed over the complete corpus. The average may be consulted afterwards. The highly-voted individual reviews may be read, but only as case material, never as statistical evidence.
2. Step one: pull the complete corpus, not a sample
2.1 What “complete” means, and why sampling is not enough
“Complete” here means: under fixed collection conditions — marketplace, language, sort order, and collection timestamp — every review page for the ASIN is retrieved, page by page, producing a corpus with a known denominator. Sampling fails for two reasons. First, complaint themes follow a long-tail distribution: the frequent themes matter, but the low-frequency tail is where the most severe problems hide — safety issues, breakage, total product failure. Any sample systematically under-represents exactly the complaints that matter most. Second, every ratio in the analysis needs the true denominator: the critical-review rate and each theme’s share of the critical subset are all computed against the total count. A sample yields estimates with error bars, and the error is unquantifiable when the “sample” is simply the first N pages of a platform-ranked list, which is not random sampling at all.
2.2 The field list
A properly collected corpus carries, for every review, at least the following fields. Missing key fields force later stages of the analysis to degrade.
| Field | Used for |
|---|---|
| Review ID | The unique key for deduplication and incremental updates |
| Star rating (1–5) | Distribution computation and cutting the critical subset |
| Title and body text | The object of theme clustering |
| Review date | Time slicing: separating persistent problems from batch-specific ones |
| Verified Purchase flag | A weighting reference distinguishing buyer feedback from non-buyer reviews |
| Purchased variant | Localising a complaint to a specific size, colour, or model |
| Helpful votes | A reference when reading individual cases — never a statistical weight |
| Marketplace and language | Recording collection conditions so the corpus is reproducible |
2.3 Completeness checks
Three checks close the collection step. Page reconciliation: the number of pages actually retrieved must match the total the interface reports; a page that failed mid-run is re-fetched, not skipped. Deduplication: records are deduplicated on review ID, since pagination boundaries can surface the same review twice. Missing-field marking: a review that lacks a variant or a date is kept and flagged, not deleted — deleting it would silently change the denominator. In engineering terms, this collection is normally done through a review API, page by page: the caller pages through the full result set, persists each page, merges on review ID, and archives the collection conditions (marketplace, timestamp) alongside the corpus itself.
2.4 Corpus storage and incremental updates
The corpus is the substrate for every later analysis and for monitoring, and how it is stored decides whether it can be reused. Three rules. Store raw records: persist the fields exactly as collected, with no filtering or rewriting at collection time, so that a later change in analytical definitions never forces a re-collection. Store the collection log: marketplace, timestamp, page count, failures and re-fetches are archived with the corpus — this log is the only evidence available when two runs disagree and someone asks why. Merge incrementally on review ID: later pulls append new reviews and refresh mutable fields such as helpful votes, rather than replacing the table wholesale. A corpus maintained this way is what makes the monitoring phase of section 7 possible at all: monitoring is, in essence, the same corpus continued over time under the same definitions.
3. Step two: compute the star distribution, then cut the critical subset
3.1 Distribution first
With the complete corpus in hand, the first computation is not the average but the count and share of each star level. The distribution table answers three questions: how large is the satisfied side (4–5 stars) versus the dissatisfied side (1–2 stars); how thick is the middle layer (3 stars); and is the overall shape unimodal, bimodal, or flat? This methodology defines the critical subset as the 1–3 star reviews, and the inclusion of 3 stars needs justification, because 3 is the scale’s midpoint. The justification is textual: the large majority of 3-star reviews contain a concrete complaint — “good product, but…” — and the complaint is precisely the object of negative-feedback analysis. Excluding 3 stars would systematically discard the class of problems that is most fixable: buyers who broadly accept the product and are unhappy about one specific thing.
Three numbers from the distribution deserve to be recorded explicitly, because everything downstream references them: the critical share (the 1–3 star fraction of the total, which sizes the problem), the 1-star share on its own (which separates outright rejection from qualified dissatisfaction), and the thickness of the 3-star layer (which measures the population of almost-satisfied buyers — usually the cheapest satisfaction to win back). The distribution also settles a scoping question before any manual work begins: if the critical subset is small, clustering it is an afternoon’s reading; if it is large, clustering is not optional diligence but the only way the subset can be understood at all.
3.2 A worked example: one set of checkable numbers
The following figures come from a real measurement, stated with its method and date so they can be checked and cited correctly: on 12 October 2026, the review corpus for AirPods Pro 3 (ASIN B0FQFB8FMG, Amazon US) was pulled via the Pangolinfo Review API. The corpus contained 4,268 reviews, of which 1,392 were critical (1–3 stars) — 32.6% of the total. This is a point-in-time measurement; review totals grow continuously, so the current numbers will differ. What is reproducible is the method and the definitions, not the static figures.
What the figures demonstrate is the cost of average-first thinking. Nearly one review in three sits in the critical band — a judgement no average rating, whatever its value, can express. And the subset is large in absolute terms: 1,392 critical reviews cannot be characterised by reading a handful of them. They require the systematic treatment of the next step.
4. Step three: cluster the critical subset into themes
4.1 Coding: turning text into countable themes
Theme clustering, methodologically, is content coding: read each critical review, assign it one or more theme labels, then count by label. Three rules govern the coding. First, multi-label assignment. A single review complaining about both fit and battery life is normal; forcing one label per review artificially deflates every secondary theme. Second, themes are induced from the data, not fixed in advance. A starter codebook is useful scaffolding, but when a complaint fits no existing theme, the correct move is to add or split a theme — not to force the review into the nearest category. Third, merge synonyms. Complaints worded differently but pointing at the same underlying problem must land in the same theme, or the counts will be diluted by phrasing.
To illustrate the coding action (these are method examples, not findings from the measurement above): a review saying “my ears hurt after two hours” is coded as wearing comfort; a review saying “keeps disconnecting on the subway” is coded as connection stability. Each theme ends with two numbers: its hit count, and its share of the critical subset. The denominator must be the critical subset, not the total corpus — a theme’s share answers the question “among unhappy buyers, how many are complaining about this?”, and with the wrong denominator the priority ordering distorts.
4.2 Add the time dimension
Totals alone conceal a theme’s nature. Slicing theme counts by review date — monthly or quarterly — reveals two distinct shapes. Persistent themes hold a stable share across periods; they usually point at something inherent in the product’s design or positioning. Batch themes spike in one period and vanish; they usually point at a production batch, a firmware update, or a shift in the buyer population brought in by a promotion. The responses are opposites: persistent themes belong on the product roadmap, batch themes belong in a change log investigation. Averaging them together in a single total destroys the most valuable attribution signal in the data.
4.3 The limits of automation
Keyword rules and large language models can assist with first-pass screening and pre-coding, and at the scale of a thousand-plus critical reviews they cut the manual reading cost substantially. Two steps, however, cannot be delegated. Theme naming and merging require human review: automated clustering readily produces themes that sound plausible but do not exist in the data, or merges two distinct problems into one. And sample re-reading is not optional: for each theme, pull a random handful of its source reviews and verify the coding before trusting the counts. The conclusion of this section: automation supplies the scale; humans own the definitions.
5. Step four: translate theme clusters into actions
Clustering ends in a change list. The translation works by classifying each theme cluster by the nature of the problem, then assigning it to the side that can actually fix it:
| Problem type | Typical signature | Product-side action | Listing / content-side action |
|---|---|---|---|
| Product defect | Durability, performance, or workmanship complaints, stable across periods | Enter the product iteration and quality-control backlog, scheduled by severity | State capability limits honestly on the page, to stop manufacturing further expectation gaps |
| Expectation gap | The complaint directly contradicts an advertised selling point; buyers feel misled | Audit whether the claim has test evidence behind it | Correct the copy and image claims; remove or qualify promises that cannot be kept |
| Usability barrier | The product works, but buyers cannot set it up or use it correctly | Reduce onboarding cost; improve the manual | Pre-empt the problem with setup instructions and troubleshooting steps in the page content and Q&A |
| Fit / compatibility mismatch | Negative reviews caused by choosing the wrong size, model, or compatible device | Increase differentiation between variants | Add fit tables and selection guides that stop the wrong purchase before it happens |
Prioritise the change list with a simple function: frequency × severity × fixability. Frequency comes from the cluster counts; severity asks whether the complaint involves a non-functional product, a safety concern, or a return; fixability asks whether the problem can be solved on the current product at all. In practice, expectation gaps and usability barriers usually rank first: their frequency is rarely low, and they require no product change — the page can be fixed today. Product defects, however frequent, follow the iteration cycle; their correct destination is a roadmap item, not a copy edit. The final deliverable of the whole methodology is three artefacts: the ranked theme table (with counts and shares), representative verbatim quotes for each theme (so the team feels the problem directly, not through a summary), and the prioritised change list.
Delivery of the change list is not the end of the loop. After the changes ship, re-measure with the same definitions: whether the corresponding theme’s share of new reviews has fallen is the only valid test of whether a change worked. If the page was edited and the product revised but the complaint theme has not moved, the failure sits in the translation step — what was changed was not what buyers were complaining about — not in buyers “not having noticed yet”. This re-measurement also produces the baseline distribution that the monitoring phase in section 7 needs: without a baseline, alert thresholds have nothing to be set against.
6. The cost model: per-page billing and the limits of the free tier
The billing model of a review API determines the cost structure of this work, and it should be computed before anything is collected. Pangolinfo’s review interface bills per page, at 5 credits per page; the free tier provides 60 credits per month, resetting monthly — which converts to 12 pages. These numbers draw two clear boundaries. The free tier is enough for a sampling pass: take a low-volume ASIN, or the first pages of a large one, and run the full pipeline — fields, collection flow, coding method — end to end. A complete corpus usually requires a paid plan: a popular ASIN accumulates thousands of reviews across hundreds of pages, and 12 free pages cannot cover it arithmetically. That is not a defect of the free tier; it is the inevitable cost of the word “complete”. The correct sequence is: validate the pipeline and the definitions on the free tier, estimate the page count from the target ASIN’s review volume, then choose a paid tier sized to the estimate — never the reverse order of buying capacity first and deciding what to collect afterwards. Two properties of the per-page model make this budgeting straightforward. First, the estimate is knowable in advance: a corpus’s page count is a function of the ASIN’s review volume, so the credit cost of a full pull can be computed before committing to it, rather than discovered during it. Second, the model scales linearly across a portfolio: monitoring ten competitor ASINs costs the sum of their individual page estimates, with no platform fee hiding in the structure. Per-page billing therefore rewards exactly the discipline this methodology prescribes — define the corpus first, then pay for precisely that corpus.
7. From one-off analysis to continuous monitoring
The methodology above produces a point-in-time snapshot, but negative feedback is not a static asset: a new production batch, a firmware update, or a competitor’s price cut will grow new themes in the review stream and shrink old ones. A one-off analysis answers “what is the problem now”; it cannot answer “is the problem getting better or worse”. The complete loop therefore has two phases: run the full-corpus analysis once to establish the theme codebook and the baseline distribution, then connect scheduled monitoring — incrementally pulling new reviews on a fixed cadence, counting them against the same codebook, and alerting when a theme’s share crosses a threshold. The monitoring phase already has a published hands-on companion: Monitoring Amazon Reviews on a Schedule with n8n, which covers the timed workflow, incremental pulls, and alert configuration. Analysis sets the baseline; monitoring watches the change; both share one field list and one codebook. That is the final step in turning review data from a one-off report into a standing pipeline.
This article is part of the Complete Guide to Amazon data scraping series — the pillar guide, The Complete Guide to Amazon Data Scraping: From Beginner to Expert (2026), maps every data type, the four-level roadmap, and the entry points to all companion articles; this article is the C-group piece covering the complete handling method for one data type: reviews.