

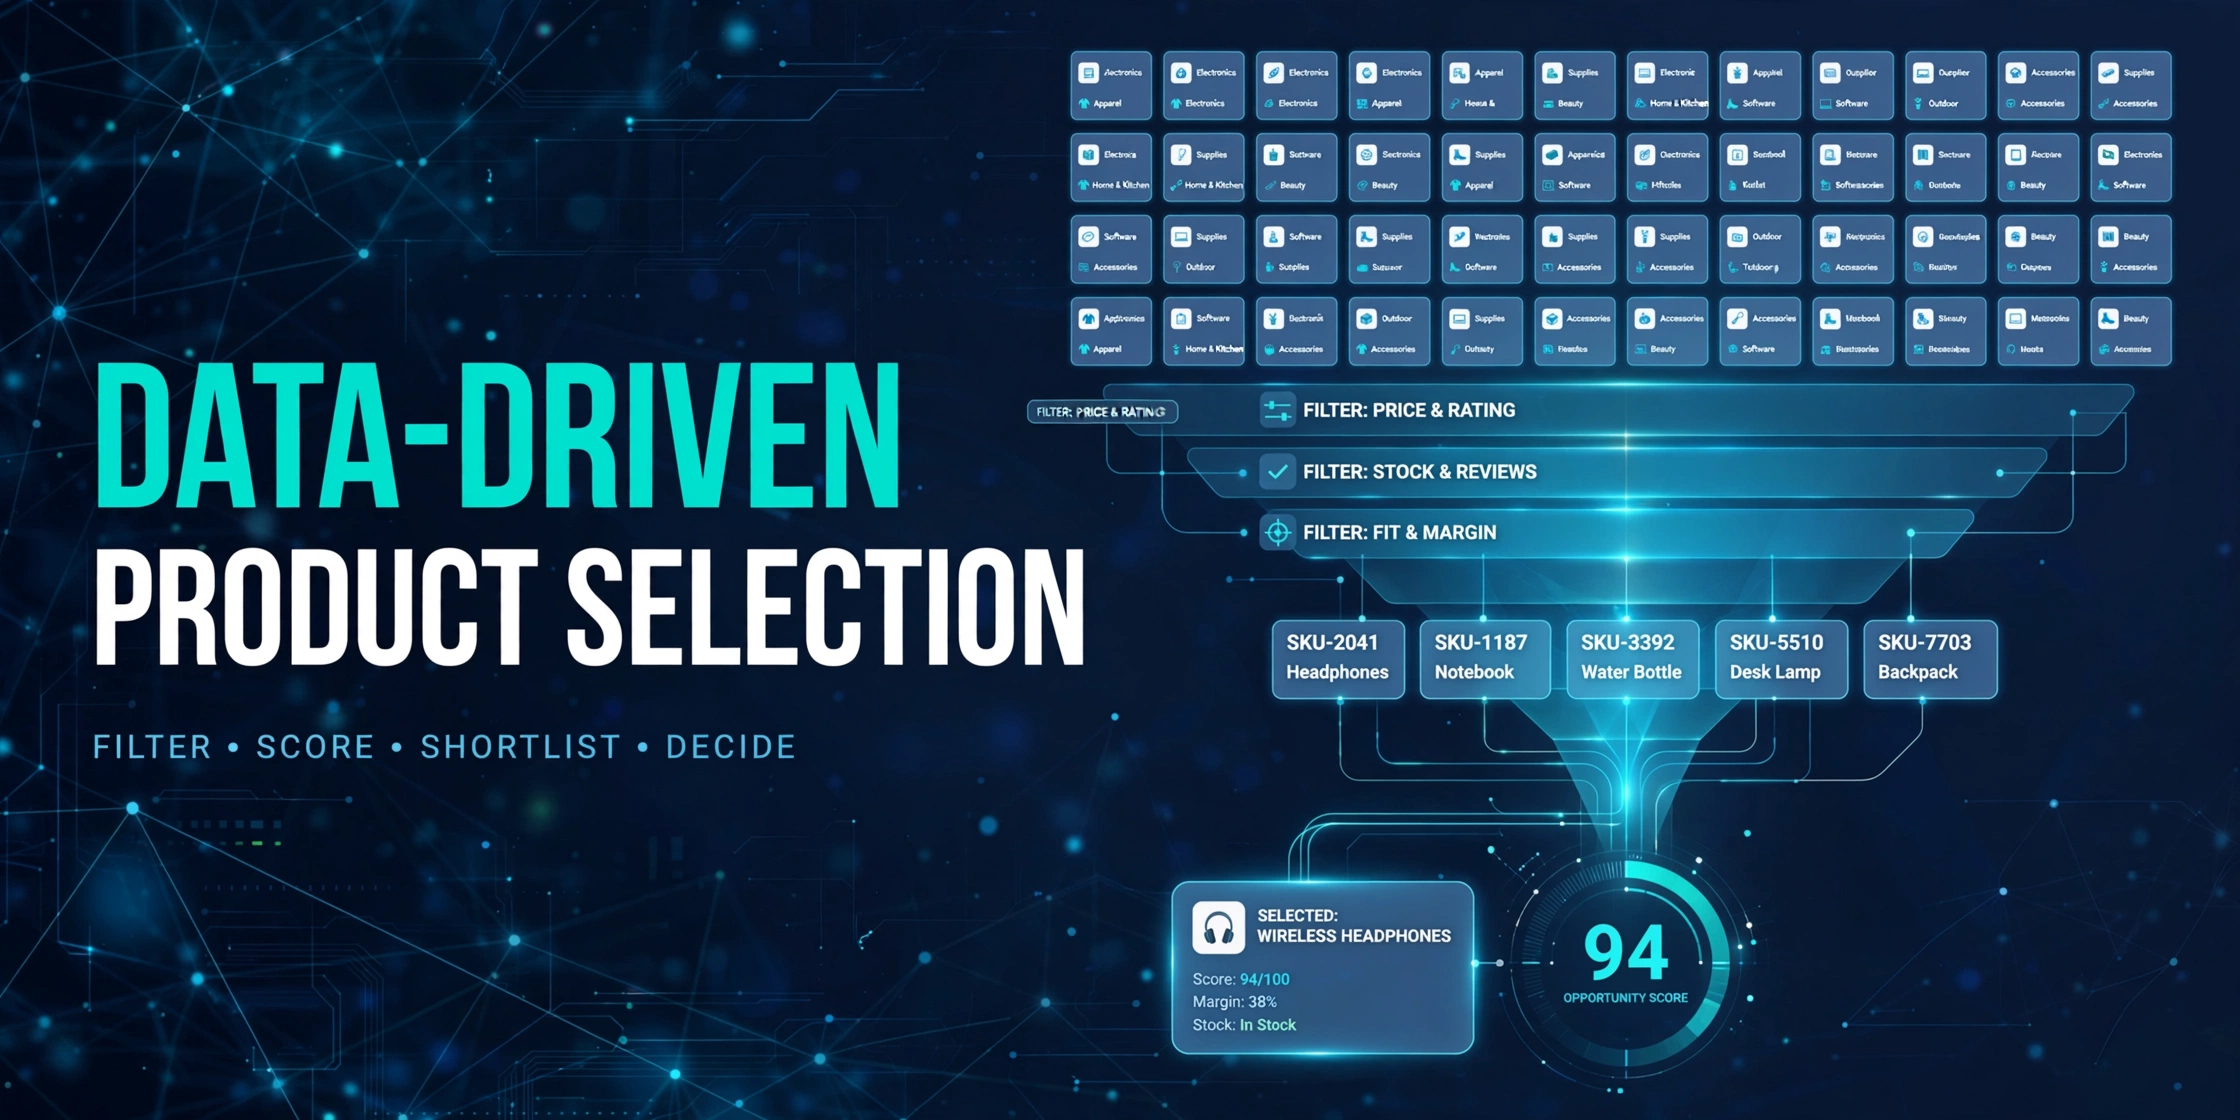
There is no shortage of writing on Amazon product selection, but most of it teaches single-point techniques: how to read one metric, how to enter one category, how to use one tool. Single-point techniques share a hidden assumption — that you already have a candidate product. The hard part of selection sits upstream of every technique: where candidates come from, by what standard they are ranked, and on what grounds they are eliminated. This article offers no new technique. It offers the process framework that organizes the techniques: a complete decision pipeline from category scan to opportunity score.
The conclusion first. The deliverable of product selection should not be “one good product”; it should be a reproducible pipeline: constraint definition → category scan → candidate pool → hard filters → opportunity scoring → review validation → monitoring hand-off. Remove any stage and selection degenerates into luck. Without constraints, ranking has no basis. Without a candidate pool, the field of view is locked by a handful of visible bestsellers. Without hard filters, time is burned on products that are structurally impossible for you. Without explicit scoring, decisions cannot be audited later. Without validation, the top-scored candidate may be the most dangerous one. Without a monitoring hand-off, the conclusion starts expiring the day it is made.
This is the first article in the E group (scenario practice) of this series, and it serves as the methodological base for the practice articles that follow. Collection methods are referenced, not re-taught: how to collect product data in bulk is covered in C1, How to Bulk-Scrape Amazon Product Data; how to collect reviews and run complaint analysis is covered in C4, How to Scrape Amazon Reviews and Analyze Complaints — both published in the same batch as this article. Systematic collection of search-result and ad-placement data (C2) and of ranking data (C3) is still in preparation and is marked here by its position in the flow only.
1. Write the Selection Question Down: Constraints First
Start with a definition: product selection is the ranking of a candidate set inside a set of constraints. “Which product is good?” is meaningless outside constraints — the same category is an opportunity for a well-funded team with product-development capability and a trap for a small team testing products on a thin budget. So the first step of the process is not to look at data; it is to write the constraints down as numbers.
| Constraint class | Questions to answer | How it becomes a usable number |
|---|---|---|
| Capital | How much can the first order absorb? How long is one inventory cycle? How many products can be tested in parallel? | A floor for the viable price band (the selling price must cover freight, referral fees, advertising, and return losses), a per-product cap on first-order spend, a count of parallel tests |
| Supply chain | Which categories can your factories actually serve? What are the minimum order quantities and lead times? Can the product be modified? | An enterable category list, the capital locked by one MOQ, the replenishment cycle (which sets your stock-out risk exposure) |
| Team | Is there product development and modification capability? Who runs content and advertising? Can support absorb a complaint-heavy category? | A ceiling on product complexity, a capacity rating for review-sensitive categories (strong sizing/fit dependence, for example) |
The deliverable is a one-page constraint sheet. Every hard filter in step 4 must trace back to a line on this sheet. Constraints do not limit imagination; they make every elimination auditable — at review time, months later, you can tell whether a product was rejected because the judgment was wrong or because the constraints have changed. Note what the sheet is not: it is not a list of product ideas. Teams that start from “products we like” and retrofit constraints around them invert the process, and every later stage inherits the bias.
2. Category Scan: The Forest Before the Trees
With constraints explicit, scan categories before touching individual products. The data source here is rankings: Best Sellers lists at category and subcategory level, Movers & Shakers, and new-release lists. Rankings provide a structural snapshot of an entire category.
Four quantities to observe during the scan:
- Head concentration. How many brands occupy the top of the list, and is there a single dominant brand or an Amazon retail presence? Concentration determines whether a new entrant faces “a field of competitors” or “a wall”.
- New-entry velocity. How the new-release list and the main list turn over: can new products reach the top of the main list, and how long do they stay? Fast turnover means the category is still being reshuffled; slow turnover means the structure has set.
- Price-band distribution. Where list prices cluster, and whether there are visible price gaps. A gap is not an opportunity by itself, but it defines the price coordinate system for the candidate pool that follows.
- Review-count distribution. How large the gap is between the review counts at the head and at the waist of the category. This gap is the input to the “review wall” filter in step 4: it measures not the strength of any one product but the order of magnitude of a latecomer’s cold-start cost.
Two rules of discipline govern the scan. First, a ranking is a point-in-time snapshot: one snapshot shows structure, only repeated snapshots show trend — re-collect the same category at intervals of weeks and compare, and record the marketplace and the timestamp of every collection, or the snapshots are not comparable. Second, the scan produces a candidate category list (three to five categories, each with a one-line reason for entry), not candidate products — fixing on specific products too early is the most common way a selection process narrows its own field of view. The systematic collection of ranking data (BSR, new-release and risers lists, their definitions and cadence) is the subject of C3, in preparation.
3. Build the Candidate Pool: From Category to ASIN List
For each candidate category, gather the visible products into one ASIN list — the candidate pool. The pool is the union of three sources:
- Ranking source: ASINs from the category’s ranking lists at every level — the market-validated incumbent structure.
- Search source: ASINs from the search results for the category’s core keywords — the competitive set as shoppers actually see it. Rankings and search results do not coincide: advertising and organic placement make their composition different.
- Storefront source: ASINs sold by the main competing brands — the rivals’ product matrices, including products that survive on off-Amazon traffic and never appear on a ranking list.
After deduplication, record one set of base fields per ASIN: title, brand, price, star rating, review count, category and subcategory BSR, seller count, and time on market where available — each record stamped with its source and collection time. The field definitions and the engineering of bulk collection are covered in C1, How to Bulk-Scrape Amazon Product Data (published in this batch).
The collection route must be chosen at this point. Manual copying and browser extensions are adequate for validating a workflow; they are not adequate for building a pool: a pool runs to hundreds of ASINs, and the discipline of step 2 requires it to be re-collected and compared across time — that is the shape of an API route. In Pangolinfo’s Amazon Scraper API, for example, requests are submitted in bulk by ASIN or keyword and return structured fields, billed per call in credits; the free tier of 60 credits per month is correctly used to validate field definitions and the workflow on one small category first, not to attempt a full pool build (see the pillar guide’s FAQ for the intended role of the free tier). The methodology of choosing among collection routes is itself covered in A3, Amazon Data Scraping: 6 Methods Compared.
One rule for pool building: err wide, not narrow. Elimination is the next step’s job; an ASIN skipped here because it “looks ordinary” cannot be recovered by any later stage. Wide entry is only safe if every record’s source and timestamp are traceable — otherwise the larger the pool, the less controllable the noise. The pool is also a living artifact: each re-collection should append a snapshot rather than overwrite the previous one, because the deltas between snapshots — review growth, price drift, new entrants — are exactly the indicators the scoring stage consumes.
4. Hard Filters: Remove Only Structural Impossibilities
The principle of hard filtering fits in one sentence: remove only what is structurally impossible under your constraints; never remove what is merely difficult. The first is a constraint problem; the second is a ranking problem. Confuse the two and you either kill opportunities at the gate or force the scoring stage to carry vetoes it was not designed for. Four filters, each traceable to the constraint sheet of step 1:
- Price-band filter. Remove candidates whose selling price falls below the floor of your margin model: when the price cannot cover a reasonable estimate of freight, referral fees, advertising, and return losses, every additional unit sold increases the loss. Such candidates do not enter scoring.
- Review-wall filter. Remove candidates when the category head’s review volume is orders of magnitude beyond what your cold-start capacity can contest. This must be stated precisely: the review wall is a function of capital and time, not a fixed threshold. There is no universal “review count red line” — how high a wall you can climb depends on the test budget and ramp time you can allocate to a single ASIN. Copying someone else’s threshold is the most common error at this step.
- Brand-concentration filter. Compute the brand distribution inside the pool. If a category is sealed by one or two head brands plus Amazon’s own retail presence, with a negligible combined share left for small sellers, shelf space for a new entrant does not structurally exist — remove, or demote to the watch list.
- Hard-risk filter. Obvious design/trademark exposure, strongly certification-gated categories that mismatch your team’s qualifications, and categories under explicit policy risk are removed outright. This filter looks only at whether the exposure exists, never at how large the opportunity is; the full discussion of compliance boundaries is in section 4 of the pillar guide.
Run the filters in order of checking cost. Price band and brand concentration are computable from the pool itself; the review wall needs only head data; the hard-risk review is the only step that consumes human judgment per candidate — which is exactly why it comes last, applied to the smallest possible set.
After hard filtering, the pool should have converged to a size that can be examined product by product. Every surviving record has passed the test “structurally doable for us”. The question is now one of order: which candidates deserve validation first.
5. Opportunity Scoring: A Four-Dimension Framework
Hard filters answer “can we do it”; scoring answers “which first”. The point of making judgment explicit is not the number itself but the audit trail: explicit scoring forces judgment to leave a record, so that three months later you can see why A was ranked above B and whether the framework or the data was at fault. All four dimensions below are computable from the pool’s own fields, with no external assumptions.
| Dimension | Meaning | Indicators computable from the pool | Direction |
|---|---|---|---|
| Demand strength | The category’s overall purchase intent and trajectory | Search-result volume for the category’s core terms; head ASINs’ review stock and increment (requires repeated collection); ranking turnover speed | Positive |
| Competitive intensity | The price a new entrant must pay to be seen | Head brand concentration; the pool’s average review count; ad-placement density on search pages (requires search-result data — the subject of C2) | Inverse (weaker is better) |
| Margin headroom | The buffer between the price band and your cost structure | The rough space between the price-band median and your sourcing/logistics costs; order-of-magnitude judgment only — exact costs exist only in your own ledger | Positive |
| Risk | Category-level uncertainty | The order of magnitude of the critical-review ratio; return-sensitive traits such as sizing/fit dependence; seasonal volatility of BSR across snapshots | Inverse (lower is better) |
Score each dimension on a 1–5 scale. The anchors have no universal standard and must be calibrated to your own constraints — for example, “head ASINs’ review counts grow steadily and new products can reach the top of the ranking list” might be defined as a 5 on demand, but a test-driven team may legitimately set that anchor lower: their capital model allows demand to be verified with a small batch first, so the anchor need not be as demanding. Anchors are set by the framework’s user; the framework only requires that they be written down and not changed in the middle of a scoring round.
Weights (an example configuration, not a standard). A reasonable starting point is: demand 30%, competition 30%, margin 25%, risk 15%. This is an example configuration, not a universal weighting — the weights must be adjusted to your constraints:
- Capital is tight and test attempts are few → raise the risk and margin weights: survival outranks growth.
- Supply chain is strong and products can be modified → lower the risk weight and raise demand: you can take opportunities others cannot.
- Test-driven playbook → raise the demand weight and lower competition: verify demand truth at minimum cost first; competition is a problem for the scaling stage.
The four dimensions are designed to be as independent as the data allows: demand describes the category, competition describes the field, margin describes your own economics, and risk captures what can go wrong that the other three miss. If two dimensions consistently move together in your scoring history, merge them — double-counting is a quieter failure than omission, and harder to notice.
Three rules of discipline. First, record the weight version and the scoring date — every scoring round is an experiment log. Second, when totals tie, go back to the raw data: a score is a compression, and the raw data is the truth. Third, scoring sets the validation order; it does not make the purchase decision — scores answer “which candidates are worth validating first”, validation answers “can this actually be done”.
6. Validation: Check the Leaders with Review and Complaint Data
Three things about the top-scored candidates must be verified against real data before any sampling decision:
- What the head competitors’ critical reviews actually complain about. Complaints fall into three classes. Defect complaints (quality, durability) are opportunity signals — incumbents are doing it badly and room to improve exists. Scenario complaints (size expectations, setup instructions) are listing signals — the product is viable, but the page must answer them head-on. Structural complaints (a category-wide problem no current approach solves) are elimination signals. The same review corpus yields opposite conclusions depending on this classification.
- The critical-review ratio and the rating structure. The ratio is critical reviews divided by total reviews, but the definition must be held constant: compared within one category, at one collection time, with the counting rule stated. As a worked example of the arithmetic, take this series’ reference measurement: AirPods Pro 3 (B0FQFB8FMG), measured on 2026-10-12 via the Pangolinfo Review API, held 4,268 reviews in total, of which 1,392 were critical — a ratio of roughly one third. That number, by itself, supports no opportunity judgment whatsoever; it states the density of complaint in the category. What decides the selection conclusion is whether the complaints are solvable, not the ratio.
- Unmet needs in Q&A and mid-range reviews. Questions shoppers ask repeatedly that sellers answer badly (compatibility, use scenarios, long-term behavior) are the wedge for differentiation; the “the product is fine, but…” pivot in three-star reviews usually marks exactly what the next product iteration should fix.
The full method for collecting review data and running complaint analysis is C4, How to Scrape Amazon Reviews and Analyze Complaints (published in this batch). The cost is containable: the review interface is billed per page (5 credits per page), and validation deep-checks only the top three to five candidates. A convenient data entry point is Pangolinfo’s Amazon Review API, which returns structured reviews and rating distributions by ASIN.
Validation is deliberately asymmetric: demoting a candidate costs nothing, while resurrecting one after sampling and tooling money has been spent is expensive — so genuinely doubtful cases go to the watch list rather than through.
The validation deliverable is a one-page record per head candidate with exactly three possible verdicts — pass, demote to watch list, eliminate with the reason written down. Eliminated candidates are not deleted: archive them with the trigger condition under which they deserve re-evaluation, and they become an input to the next scan round.
7. Decision and Hand-off: Selection Is Not a One-Time Event
The decision output is not a single winner but a tiered list:
- Advance to sampling / small-batch test: the one to three candidates that passed validation;
- Watch list: candidates that scored high but failed validation, or whose timing is wrong (a seasonal category scanned off-season, for example);
- Archive: this round’s eliminated candidates with their reasons, each carrying a re-evaluation trigger.
Then the decisive step: hand both the advancing and the watch-list ASINs over to continuous monitoring — price, BSR, review velocity, competitor launches and price moves. Selection conclusions decay: a category scored at 85 today can be a 60 in three months after a head competitor cuts price; a candidate eliminated today can become viable when a head brand exits. Selection without monitoring begins expiring on delivery. How to build that monitoring is the subject of E2 (How to Build Competitor Price and Ranking Monitoring), E3 (New-Product Monitoring: Detecting New Competitors First), and D1 (Continuous Monitoring with Scheduled Workflows), in preparation.
Finally, the review discipline: once a quarter, compare scores against outcomes — how did the tested candidates perform, and did anyone succeed with a candidate you eliminated? The purpose is to calibrate the framework itself: a dimension that mispredicts consistently gets its weight or its indicators revised. A scoring framework without outcome review decays year by year; one with review is a team asset that gets sharper with use.
Conclusion
The whole pipeline compresses into one sentence: write the constraints down → scan categories for structure → build a traceable pool → hard-filter only structural impossibilities → score across four dimensions to set the validation order → verify the leaders against complaint data → decide in tiers and hand off to monitoring. Within these seven steps, data collection owns input quality — the comparability of the pool, the consistency of review definitions — while people own judgment: constraints written into weights, weights written into records, records written into reviews. Data does not make the decision for you; it makes every decision testable.
This article is part of the Complete Guide to Amazon Data Scraping series, where it serves as the methodological base of the E group (scenario practice): turning collected data into a product-selection decision that can be reproduced.